14 Whether the report reproduces
The last results chapter asks a question logically prior to every comparison in the previous five: whether the identical analysis, run twice, produces the same report. For two of the three summaries the answer is an unqualified yes. For the third it is no on a predictable class of datasets, and the diagnostics every pipeline already computes do not flag the failure.
14.1 Two summaries reproduce; one has a threshold
Across all 78 replicated fits, the PM and CB summaries agree between seeds to within 0.028 reference SD for the median person, including the four fits whose convergence diagnostics were worst (maximum \hat R up to 1.28). The GR summary exceeds a 0.10 SD median seed-to-seed movement on 11 of 78 fits, with a worst case of 0.163 SD and a worst between-seed correlation of 0.938. All 11 failures are Rasch fits of 12 to 16 items: 11 of 24 such fits fail, against 0 of 54 fits with 17 items or more. The failure is a threshold in test length, not a trend.
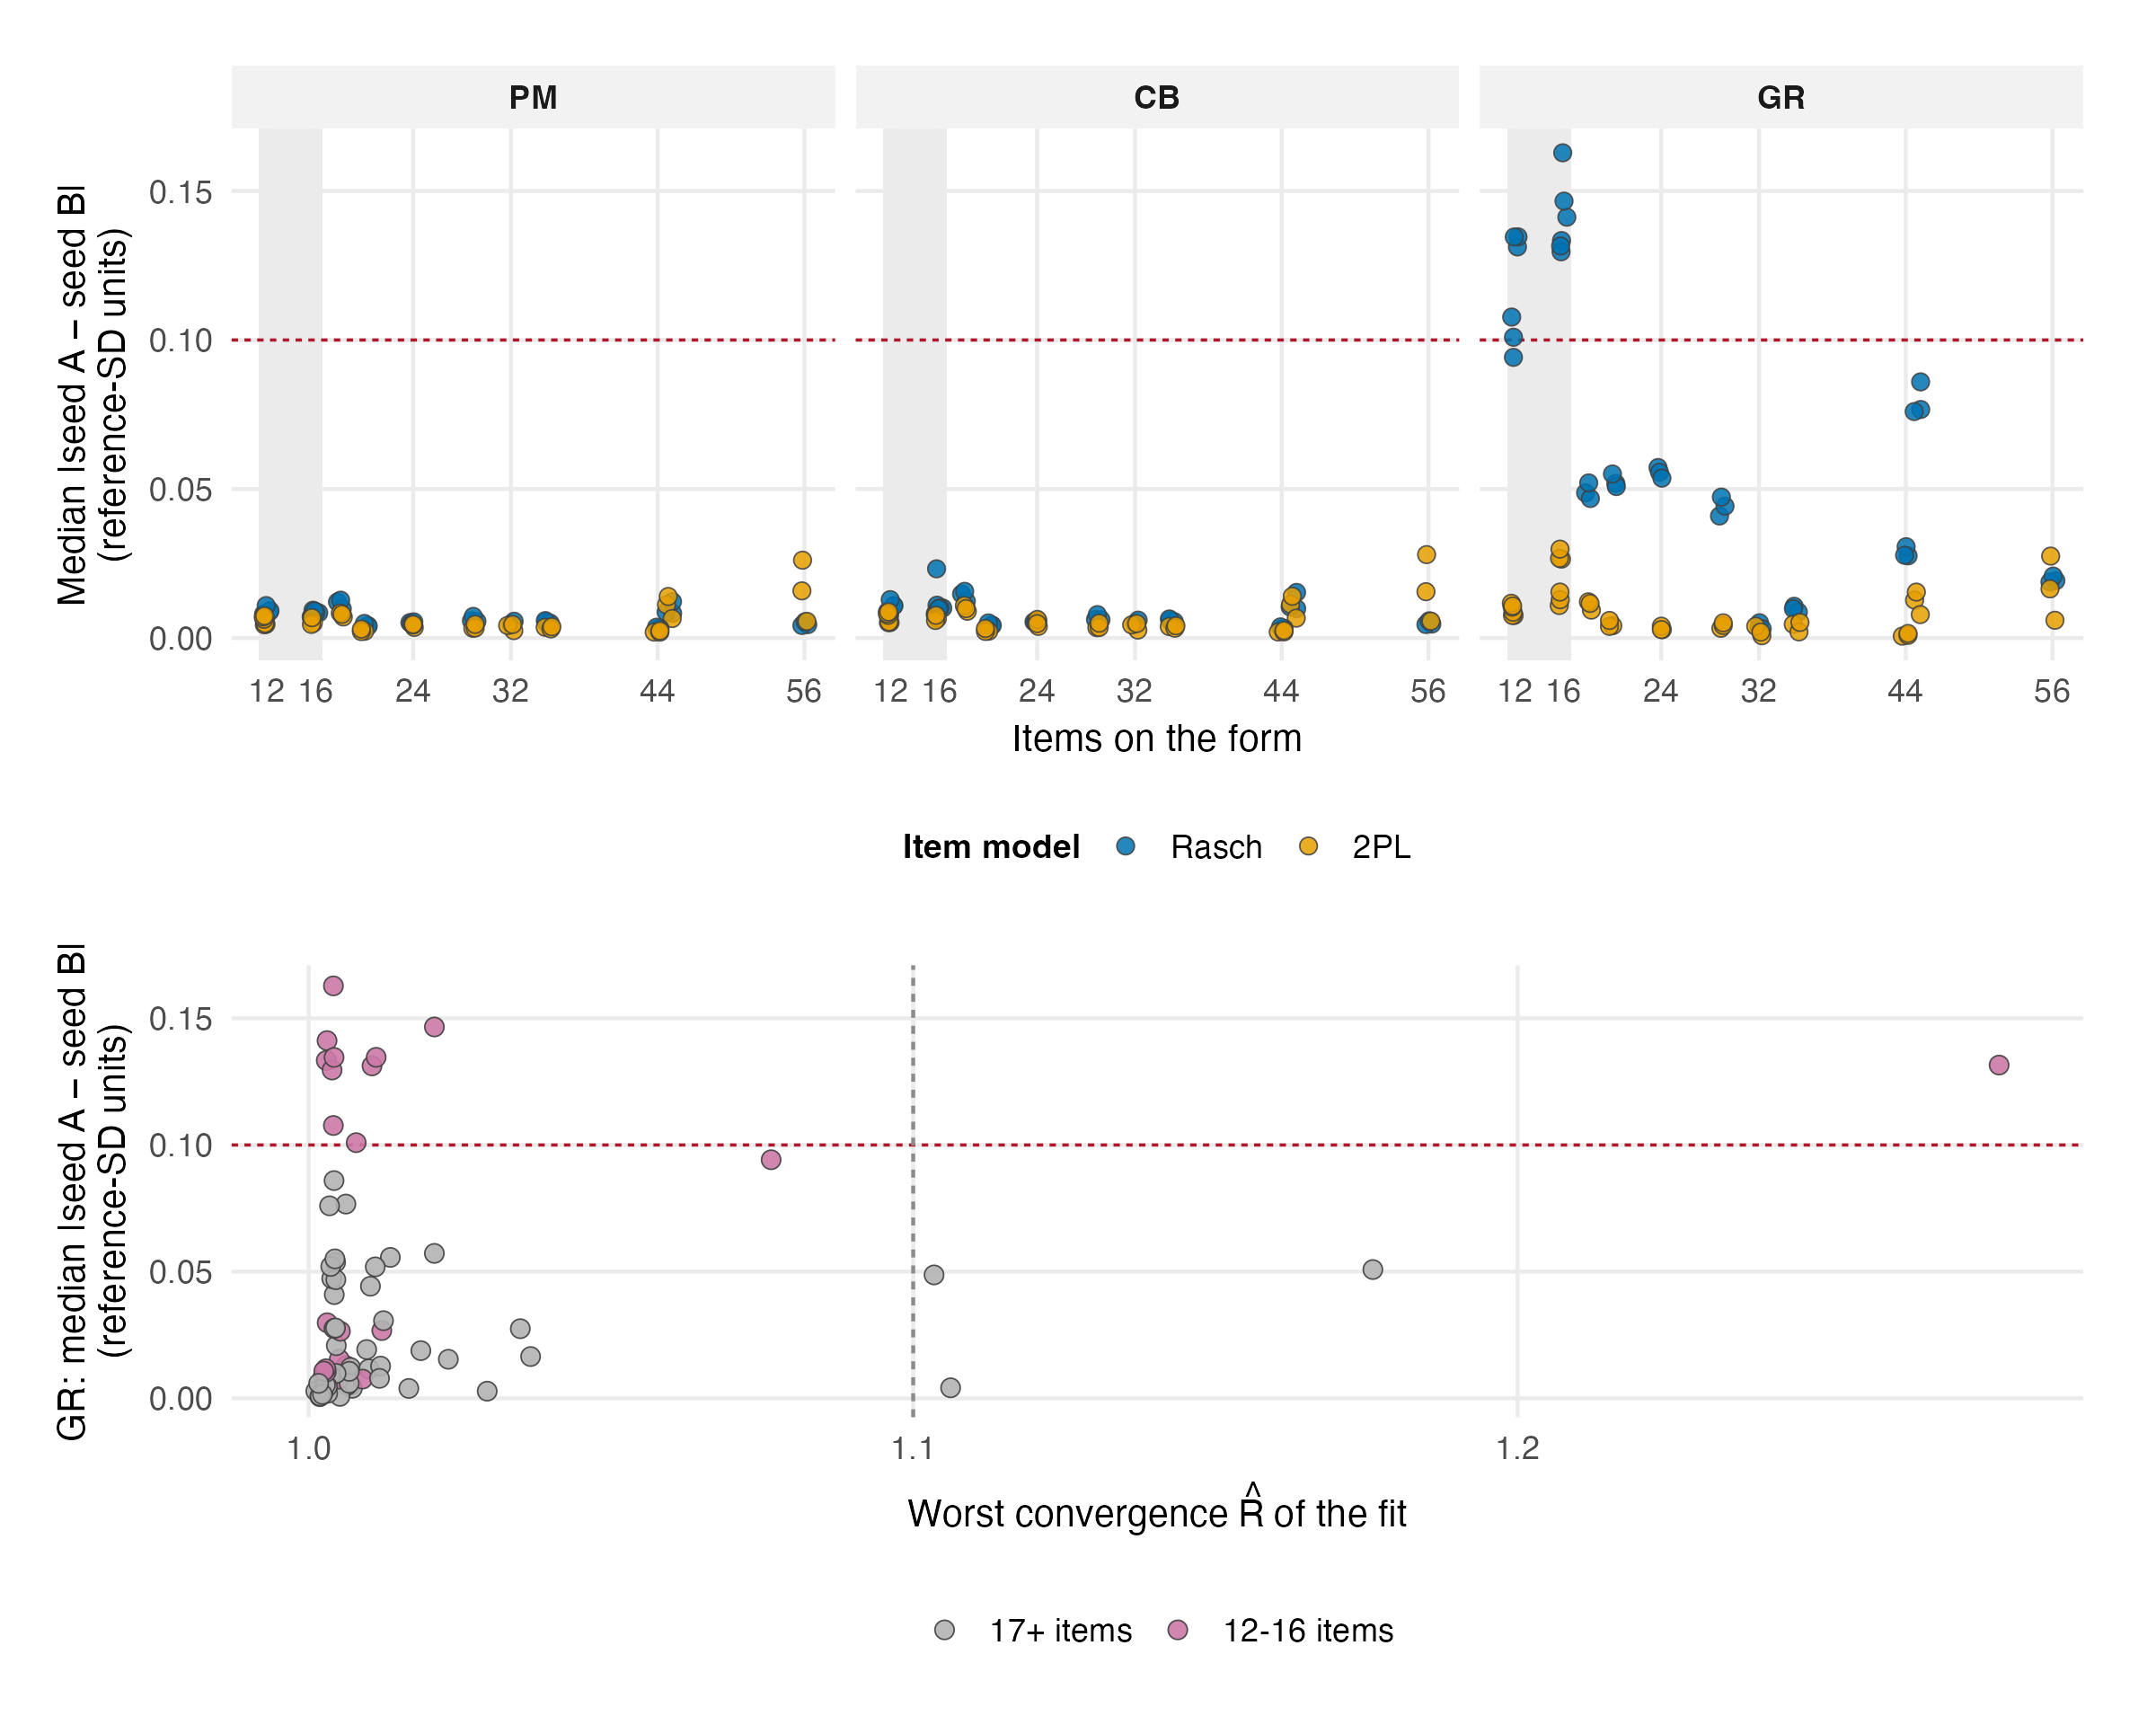
The mechanism audit rules out the tie story. Across all production fits, PM has 0 exact ties; only 4 of 78 posterior-rank rows have any exact tie, and only 2 failing rows do. In the failures, the sorted GR ensembles move only 0.001–0.005 reference SD even while aligned persons move above 0.10. Posterior-rank correlations remain 0.99986– 0.99995, but 328–493 persons change rank, with median movement 10–19 positions. The supported explanation is dense near-rank bands: small independent-refit perturbations reassign a nearly fixed set of GR quantiles across nearby people. Random resolution of exact ties is neither necessary nor common.
Nothing in that mechanism requires non-convergence. 10 of the 11 failing fits have maximum \hat R<1.05, while a screen at \hat R>1.1 catches 1 of 11. Item count separates failures from successes in this portfolio (correlation -0.66 within Rasch). Reproducibility of the reported quantity is its own property, to be measured, not inferred from chain health.
14.2 The practical rule
The finding changes practice more concretely than any recommendation in this book, because it survives every branch of the decision tree: on a form of 12 to 16 items, do not report GR from a single run. Either run the summary at two seeds and require agreement (the check costs one refit and is the only known screen), or use CB, which repairs ensemble spread, reproduces everywhere here, and concedes shape repair that a 14-item form was never going to deliver anyway. Above about 17 items the portfolio gives no reason for the extra caution (0 failures in 54 fits). The stored v1 headline used a different per-fit denominator and counted 9. This edition uses the book’s common Gaussian-PM cell reference SD throughout and counts 11; the threshold’s location, between 16 and 17 items in this portfolio, should be read as this portfolio’s gap, not a universal constant.