| Case | Instrument | Population | N total | Fitted n | Items | Tier |
|---|---|---|---|---|---|---|
| C1 | Content-literacy reading comprehension assessment | US third-grade students, online content-literacy intervention | 1914 | 500 | 29 | characterized |
| C10 | Verbal aggression questionnaire | Adults, questionnaire study | 316 | 316 | 24 | as-found |
| C11 | Story recall task 3 (prose recall scored by detail) | Adults, Automating and Improving Memory Measurement (AIMM) project at UMD | 235 | 235 | 32 | as-found |
| C12 | ZAREKI neuropsychological battery for number processing | Children, clinical neuropsychological assessment | 341 | 341 | 16 | as-found |
| C13 | Work Design Questionnaire (R package authors survey) | Adults, R package authors | 1055 | 497 | 18 | transitional |
| C2 | Vocabulary assessment from a content-literacy intervention | School students in a cluster-randomized content-literacy intervention | 2118 | 500 | 12 | characterized |
| C3 | Inductive Reasoning Developmental Test (IRDT/TDRI) 3rd version | Brazilian respondents, mixed ages | 1803 | 500 | 56 | characterized |
| C4 | Vocabulary check-list | Adults, internet sample administered alongside the Generic Conspiracist Beliefs Scale study | 2495 | 500 | 16 | characterized |
| C5 | PIRLS reading extract | Fourth-grade students, international assessment | 3480 | 500 | 35 | characterized |
| C6 | NAEP extract | US students, national assessment | 1510 | 500 | 12 | characterized |
| C7 | ENEM 2013 mathematics section | Brazilian secondary-school leavers, national examination | 999822 | 500 | 45 | characterized |
| C8 | Millon Clinical Multiaxial Inventory extract | Dutch clinical sample, adults | 1208 | 500 | 44 | transitional |
| C9 | Fraction subtraction test | Students, cognitive-diagnosis benchmark dataset | 536 | 500 | 20 | transitional |
6 The thirteen cases
The portfolio was chosen to span the simulation’s grid as far as real dichotomous data allow, not to represent any population of tests, and its deliberate imbalances are part of the design: non-normal cases outnumber controls because consequence is what the book is for, and the sparse low-reliability band is occupied at all only because two cases were recruited into it on purpose. Table 6.1 lists the thirteen; Appendix A gives each a full dossier (identity, licence, citation, coordinates, results). Here we introduce them the way they function in the book, as characters with jobs.
The skewed block carries the individual-scores story. C1 and C2 are elementary-school literacy measures from cluster-randomized intervention studies (a design audit confirmed their skew is not an artifact of pooling classrooms); C7 is half a million students’ worth of ENEM mathematics, the portfolio’s one high-stakes operational exam, characterized on a 5,000 sample; C3 is a 56-item developmental reasoning test whose reliability (.95) is the portfolio’s highest. The bimodal block carries the distribution story: C4, an internet vocabulary checklist from a conspiracy beliefs study, whose respondents divide into guessers and knowers; C8, a Dutch clinical inventory extract where a mixture is plausible a priori; C10, the verbal-aggression scale familiar from the explanatory IRT literature, small enough (316) to be fitted whole and still clear its own null. The intended normal-control candidates, C5 (PIRLS reading) and C6 (a NAEP extract), sit at usefully different reliabilities (.87 and .70). Both carry a normal-consistent class on the standardized screen, which records that a condition-sized departure of either kind would have been detected in this design and none was, rather than that the population is exactly normal.
The remaining four exist because the grid demanded them. C12, a number-processing battery administered to children in a clinical study, falls below the simulated reliability support under Rasch (\bar\rho=.425); its former .5-tier match is no longer presented as a cell placement. C13, a work-design questionnaire, was recruited as a low- reliability normal-control candidate after the reliability audit showed the original portfolio never tested the flexible prior where shrinkage is strongest. Its Rasch fit carries the normal-consistent class the recruitment wanted, at \bar\rho=.651; its 2PL fit returns undetermined, so only the Rasch row is matched. C9 is a fraction-subtraction benchmark from the cognitive-diagnosis literature, and it carries a placeable class under one item model only; C11, a rater-scored story-recall task and the smallest case (235), carries one under neither.
6.1 One dataset, two placements
Chapter 5 established that the coordinates are model-conditional; Figure 6.1 shows what that does to the portfolio. The reliability coordinate barely moves for most cases (its median absolute shift is a few thousandths), with two loud exceptions, and the shape class flips for six of thirteen: C3 and C4 and C8 read bimodal under Rasch and skewed under the 2PL; C9 reads bimodal under the 2PL and non-normal without a class under Rasch; and C12 and C13 lose their class to undetermined when the model changes. C4 is the extreme: its 2PL concentrates discrimination so heavily that \bar\rho falls to .26 while the EAP coefficient rises, and its shape statistic trades a dip for a skewness of 3.3, the portfolio’s largest.
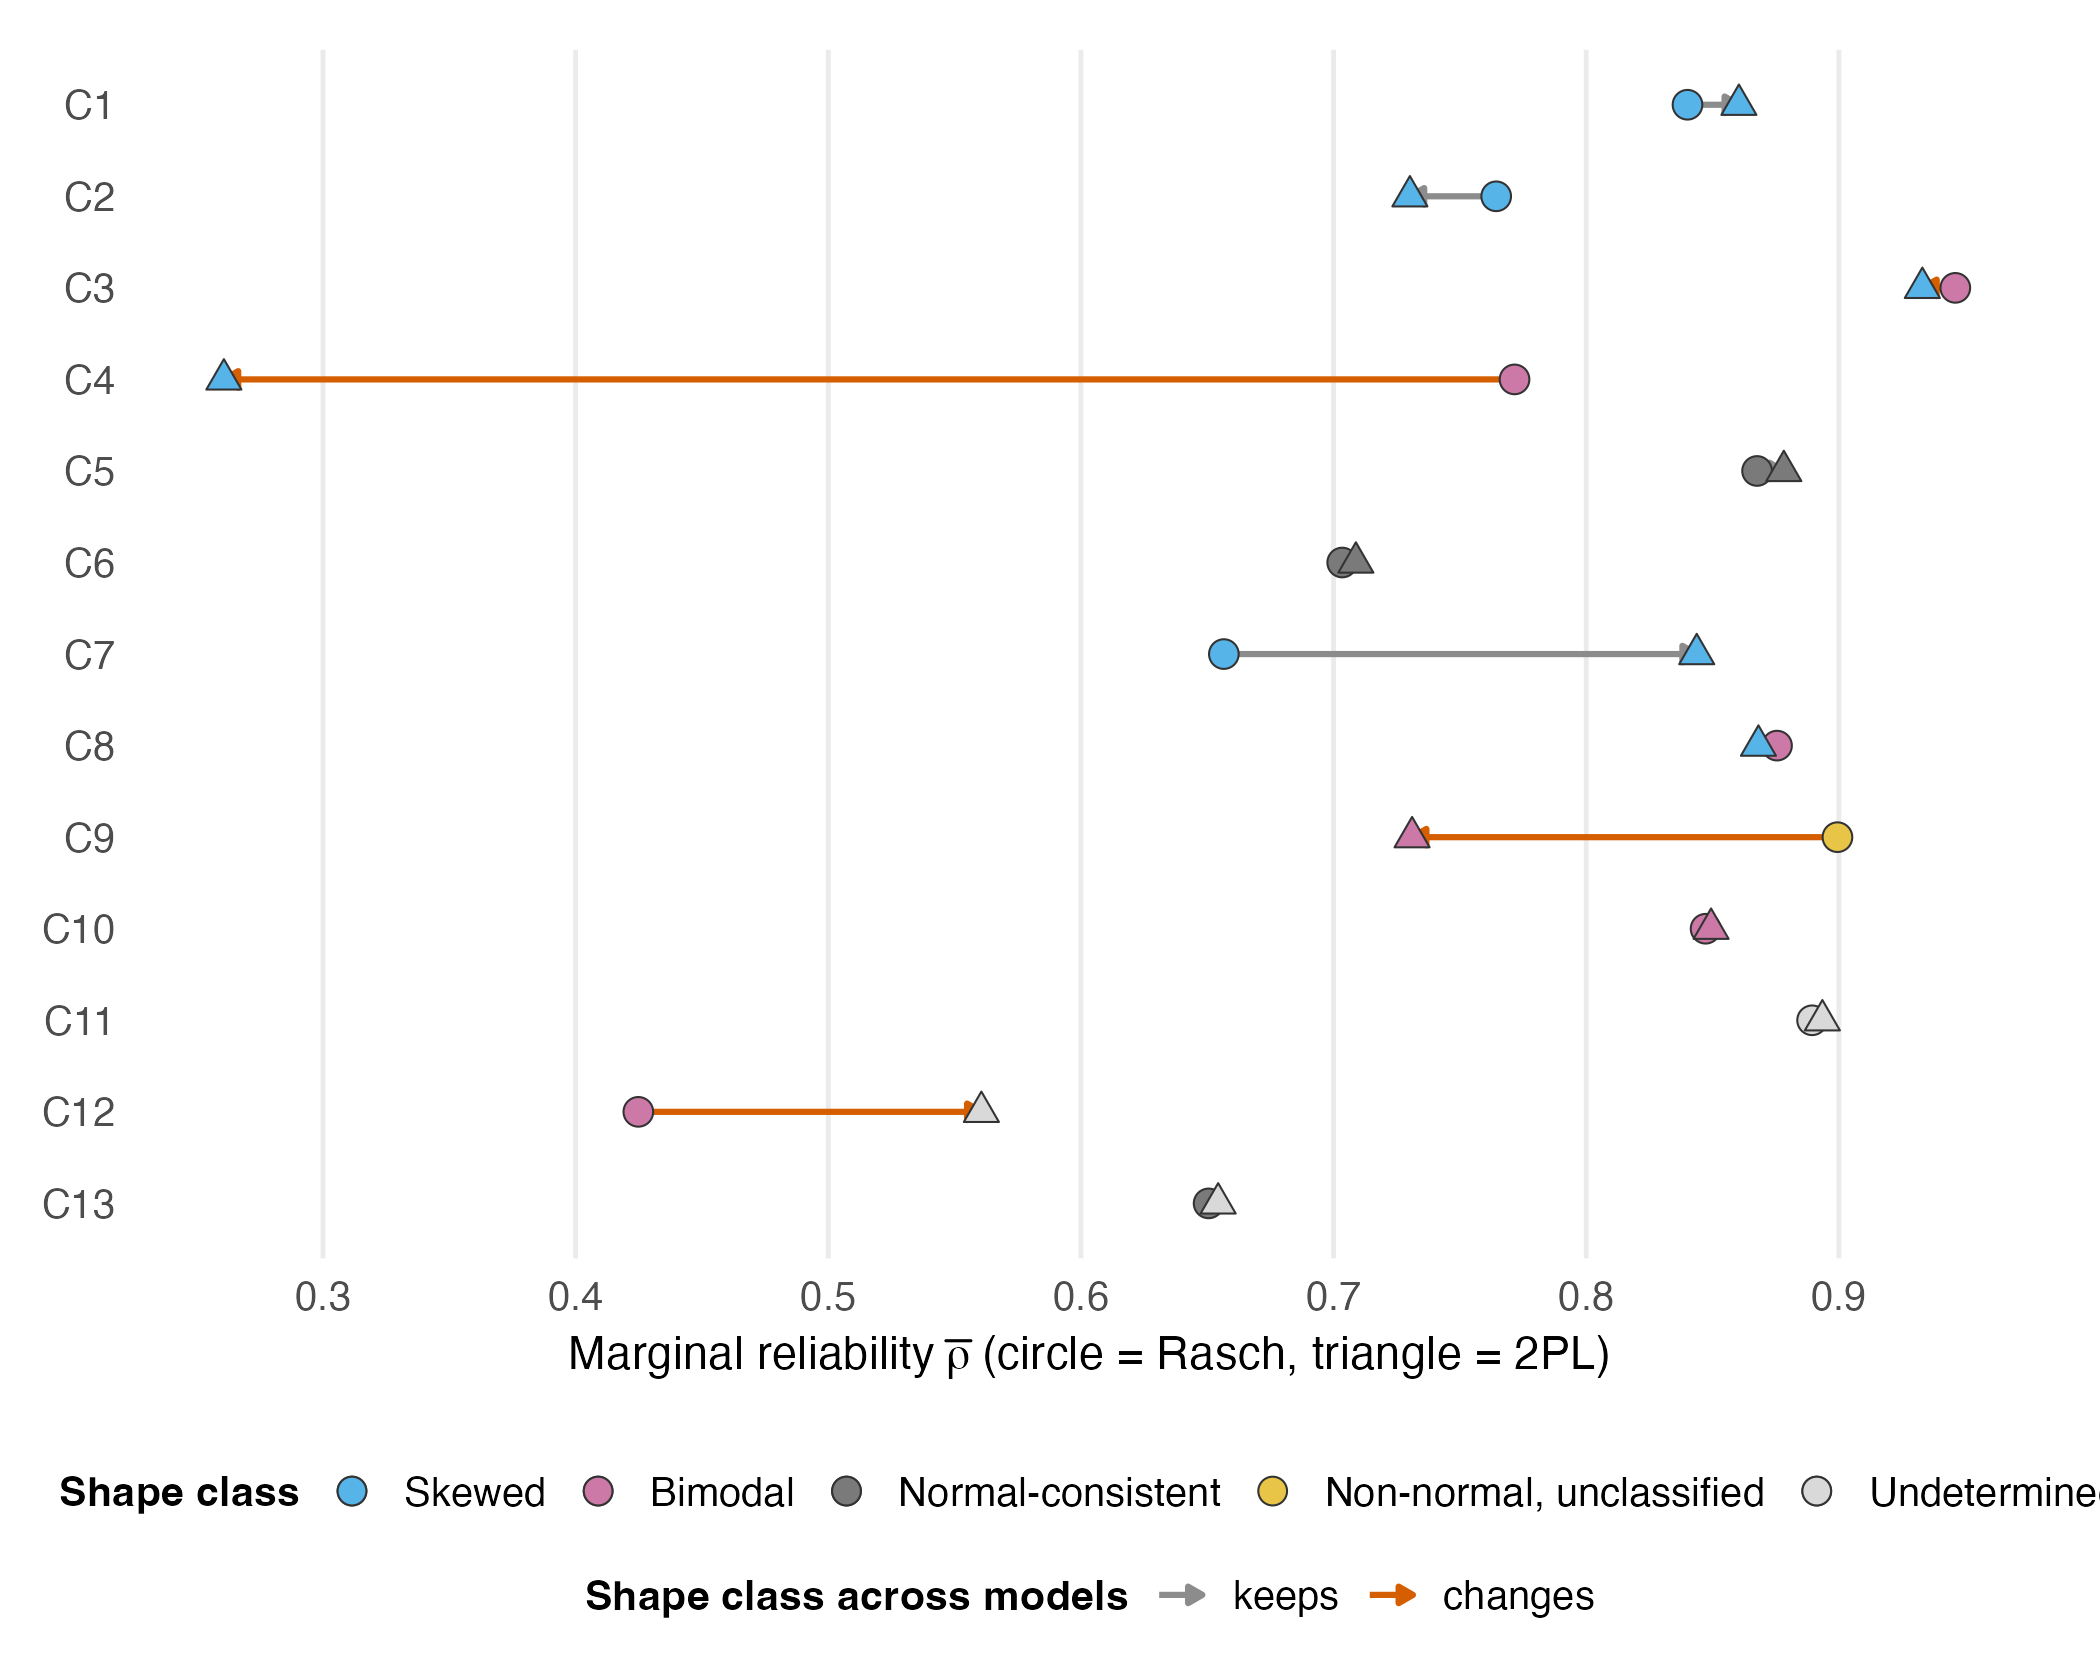
The consequence for everything downstream is that “the case” is not the unit of analysis; the case-cell is, a case under one item model, and there are twenty-six of them. The standardized screen labels nine skewed, seven bimodal, five normal-consistent, one non-normal without a class, and four undetermined, so 22 of the twenty-six carry a determinate class and twenty-one of those are in a class the simulation grid contains. After removing two reliability values below nearest-tier support, 19 rows are matched to simulation cells in Chapter 15 and are eligible for the case-specific recommendation that chapter transports.
6.2 What the portfolio cannot do
Three limits, stated here so no later chapter has to hedge. The portfolio contains two case-cells below the .5 tier’s nearest support: C12–Rasch (.425) and C4–2PL (.261). No case-study recommendation is made for that region. It contains no polytomous data, by model constraint, so nothing here speaks to rating scales. And its negative-skew cells (C2 under both models, C8 under the 2PL) are matched to the simulation’s positive-skew condition by reflection, which is exact for every symmetric quantity and requires a tail swap for named-tail statements, a bookkeeping detail that Chapter 15 carries so the reader does not have to.