13 Tails and cut scores
The fourth family is the one programs regulate by: the share of a population beyond a threshold, at risk below one, proficient above another. The blueprint predicted it would be the family most affected by the prior, on the reasoning that tails are where a flexible prior most disagrees with a normal one. The prediction was wrong in an instructive way: tails move least, except for a localized and traceable band-edge mechanism that produced the study’s largest single movement anywhere.
13.1 The family that would not move
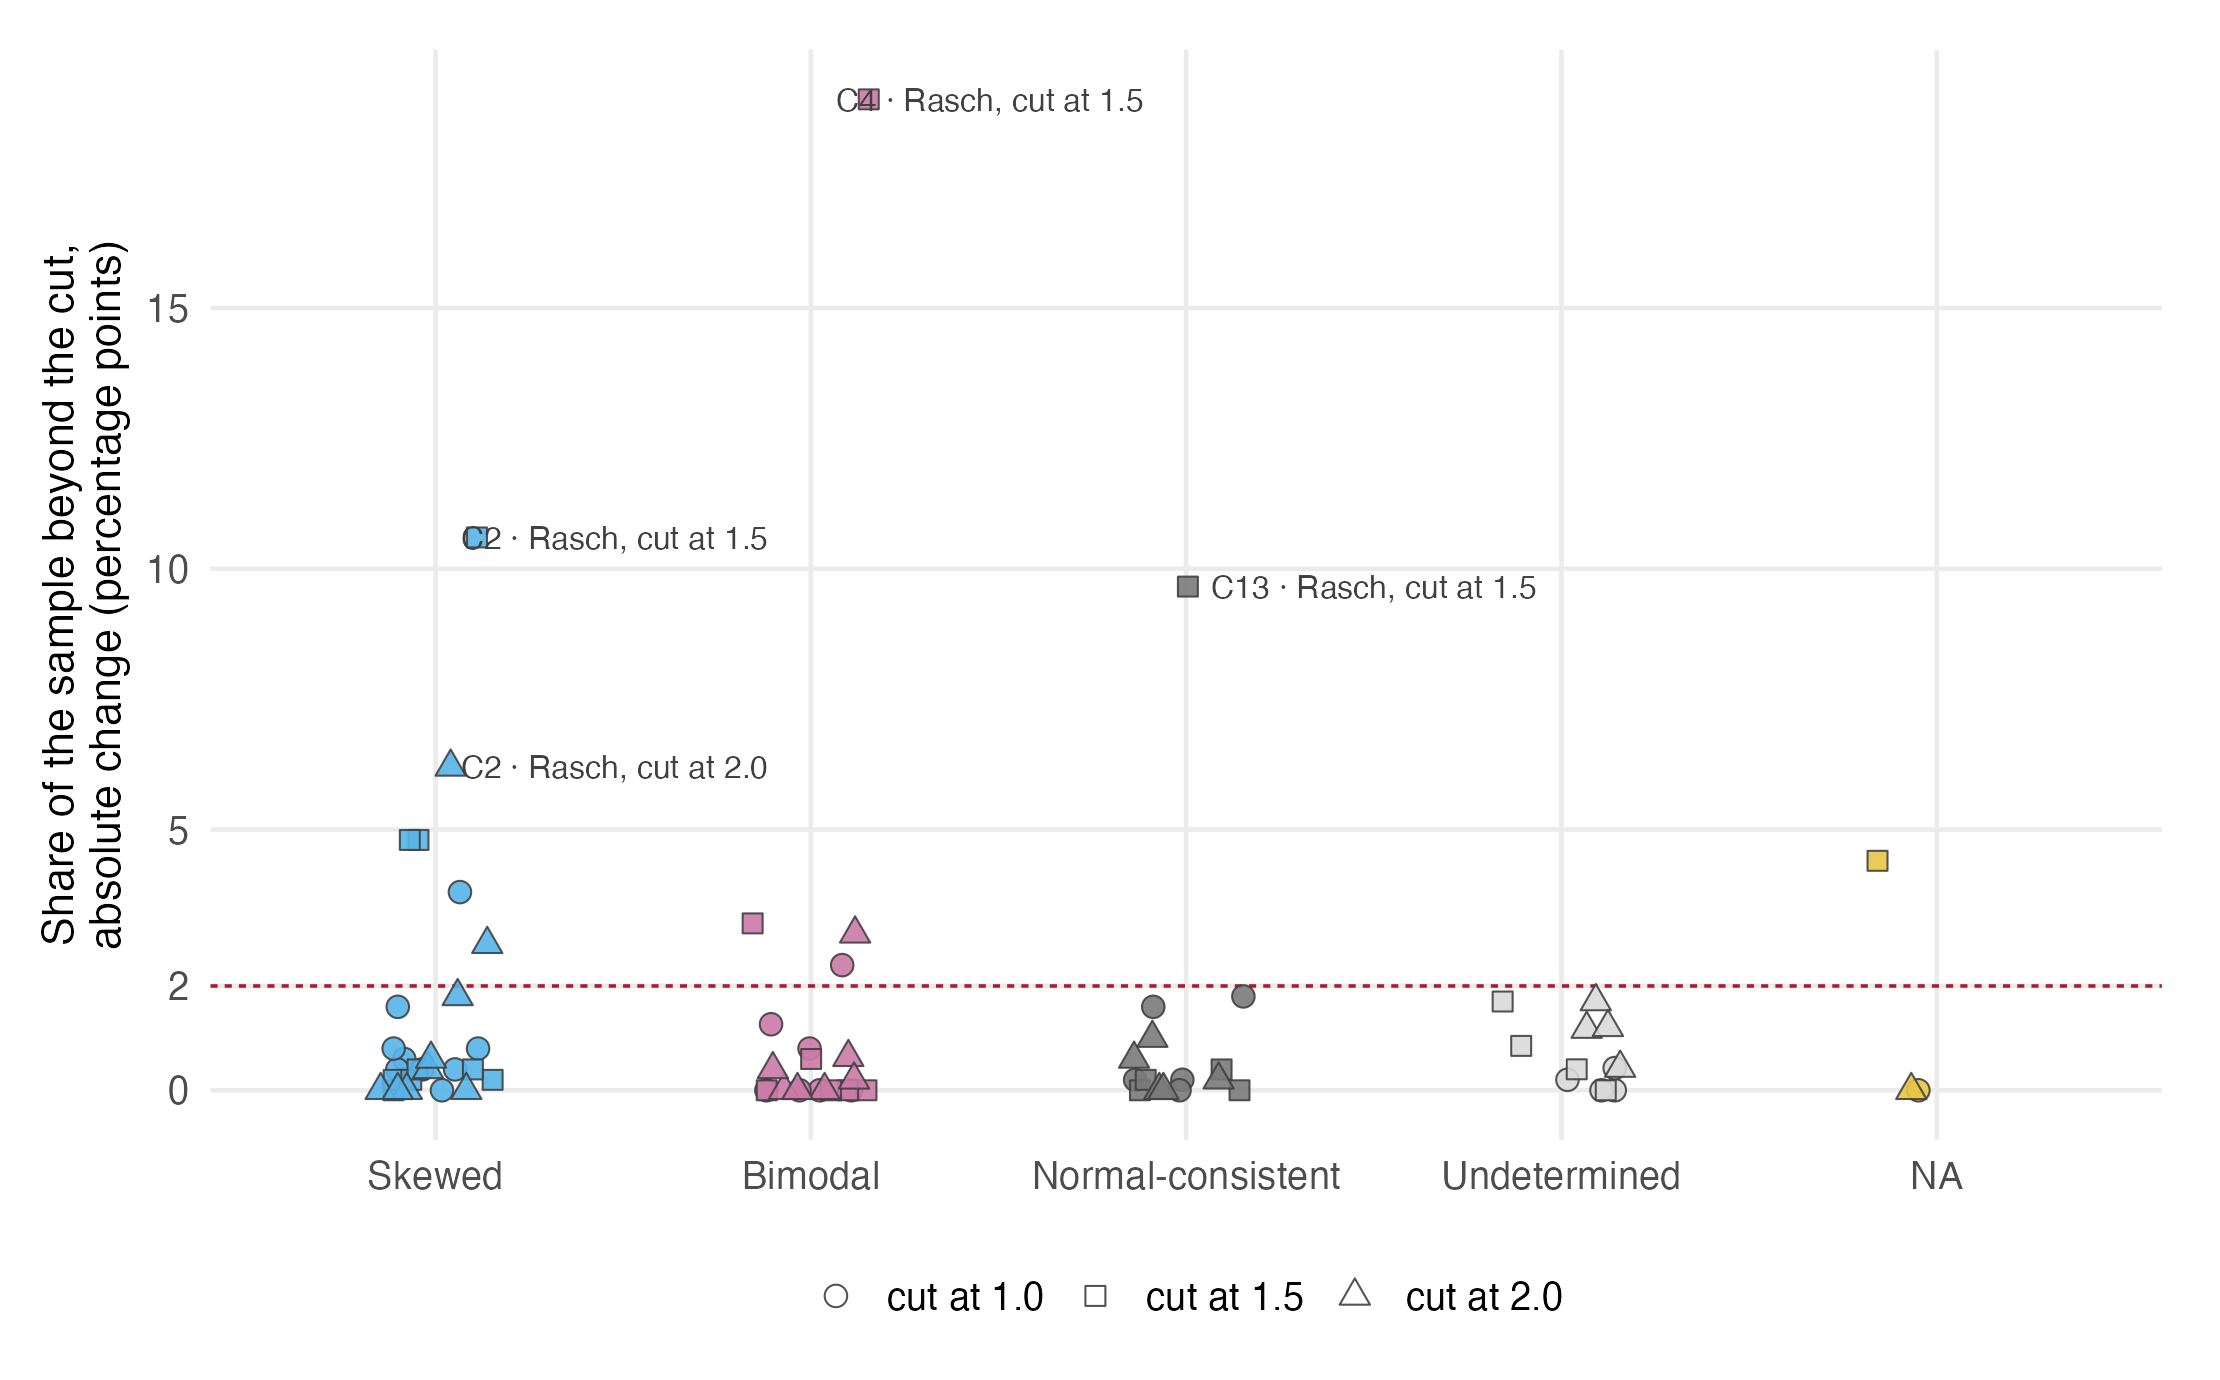
Median absolute changes in the share beyond the fixed cuts are 0.6 percentage points on the skewed cells, 0.2 on the normal controls and 0.0 on the bimodal cells at the \theta = 1 cut, against a 2-point materiality bar; the counts of cells ever crossing that bar are 3 of 9, 1 of 5, and 3 of 7. Figure 13.1 shows every cell and cut. The reason the confident prediction failed is an accounting identity the blueprint overlooked: what a net share change reports is traffic imbalance, and the prior moves people across a cut in both directions, so substantial reclassification traffic can and does net to nearly nothing.
13.2 The largest exceptions are local
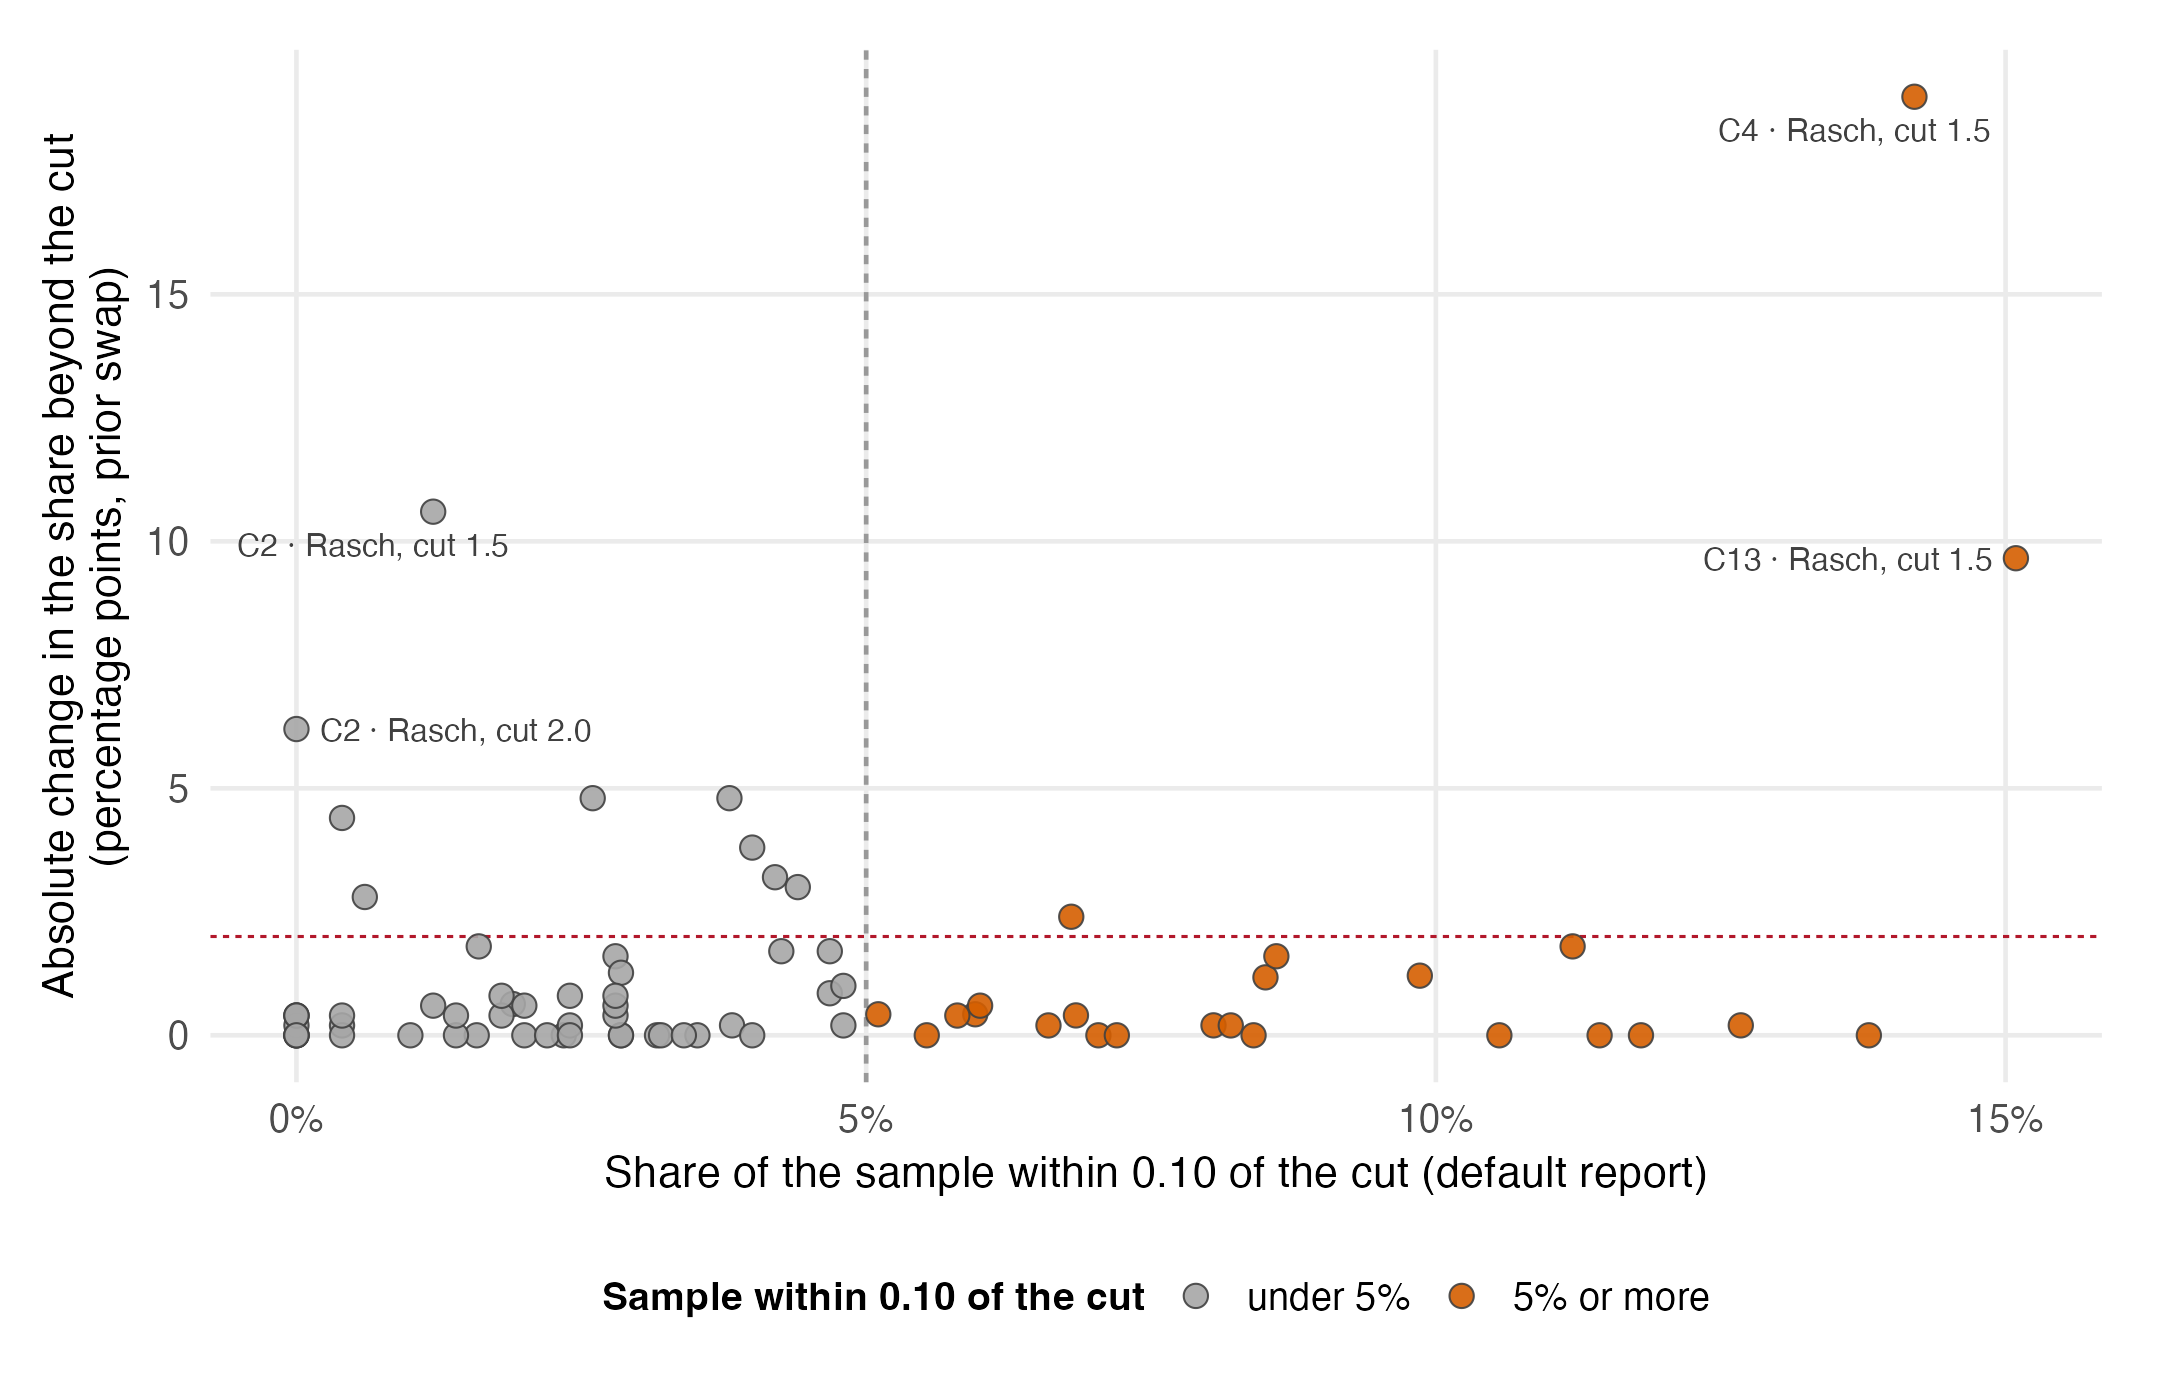
The two largest labeled movements occur at the 1.5 cut in different cases: C4–Rasch moves 19.0 points and C2–Rasch moves 10.6 points. C4’s relevant 0.02-gap band contains 95 of 500 estimates (19.0%); all 95 values are numerically distinct. C2 has 10.6% of estimates within 0.10 of the cut, while its largest band is 11.6%. Thus “both outliers are C4” and “both equal C4 clump shares” are false. The strongest C4 coincidence remains a useful exploratory observation E-01: a dense band crossed the cut and the net share matched the band share. It is a one-case diagnostic mechanism, not an exact portfolio identity.
Figure 13.2 gives the mechanism its general signature. Crowded cuts, those with at least 5% of the sample within 0.10, have a lower median movement (0.20 against 0.40 points) and a far higher maximum (19.0 against 6.2): most cuts through clumped regions fall in gaps and are perfectly stable, until one lands near an edge and is not. A cut score on a short Rasch form is locally fragile rather than uniformly unstable.
13.3 What this family establishes
Fixed-cut shares are the most stable output family under the prior swap, the reverse of the registered expectation, because two-way traffic cancels. The instability that does exist is associated with local scale granularity and mass near the cut. A pre-report audit should count the sample within a declared neighborhood and census 0.02-gap bands; those quantities diagnose risk but do not prove that the entire mass will cross. And the family’s materiality threshold, aimed at net movement, was aimed at the wrong quantity; a future design should threshold reclassification traffic as well, a correction recorded rather than retrofitted.