4 The corpus and the screen
The Item Response Warehouse (Domingue et al., 2025) harmonizes item response datasets from published research into a single long format, one row per person-item response, and it is what makes a study like this one possible at all: thirteen real assessments, fitted under identical machinery, with their provenance on record. This chapter describes how 996 catalogued units became thirteen cases, and what the corpus itself reveals about where real tests live on the simulation’s grid.
4.1 The funnel
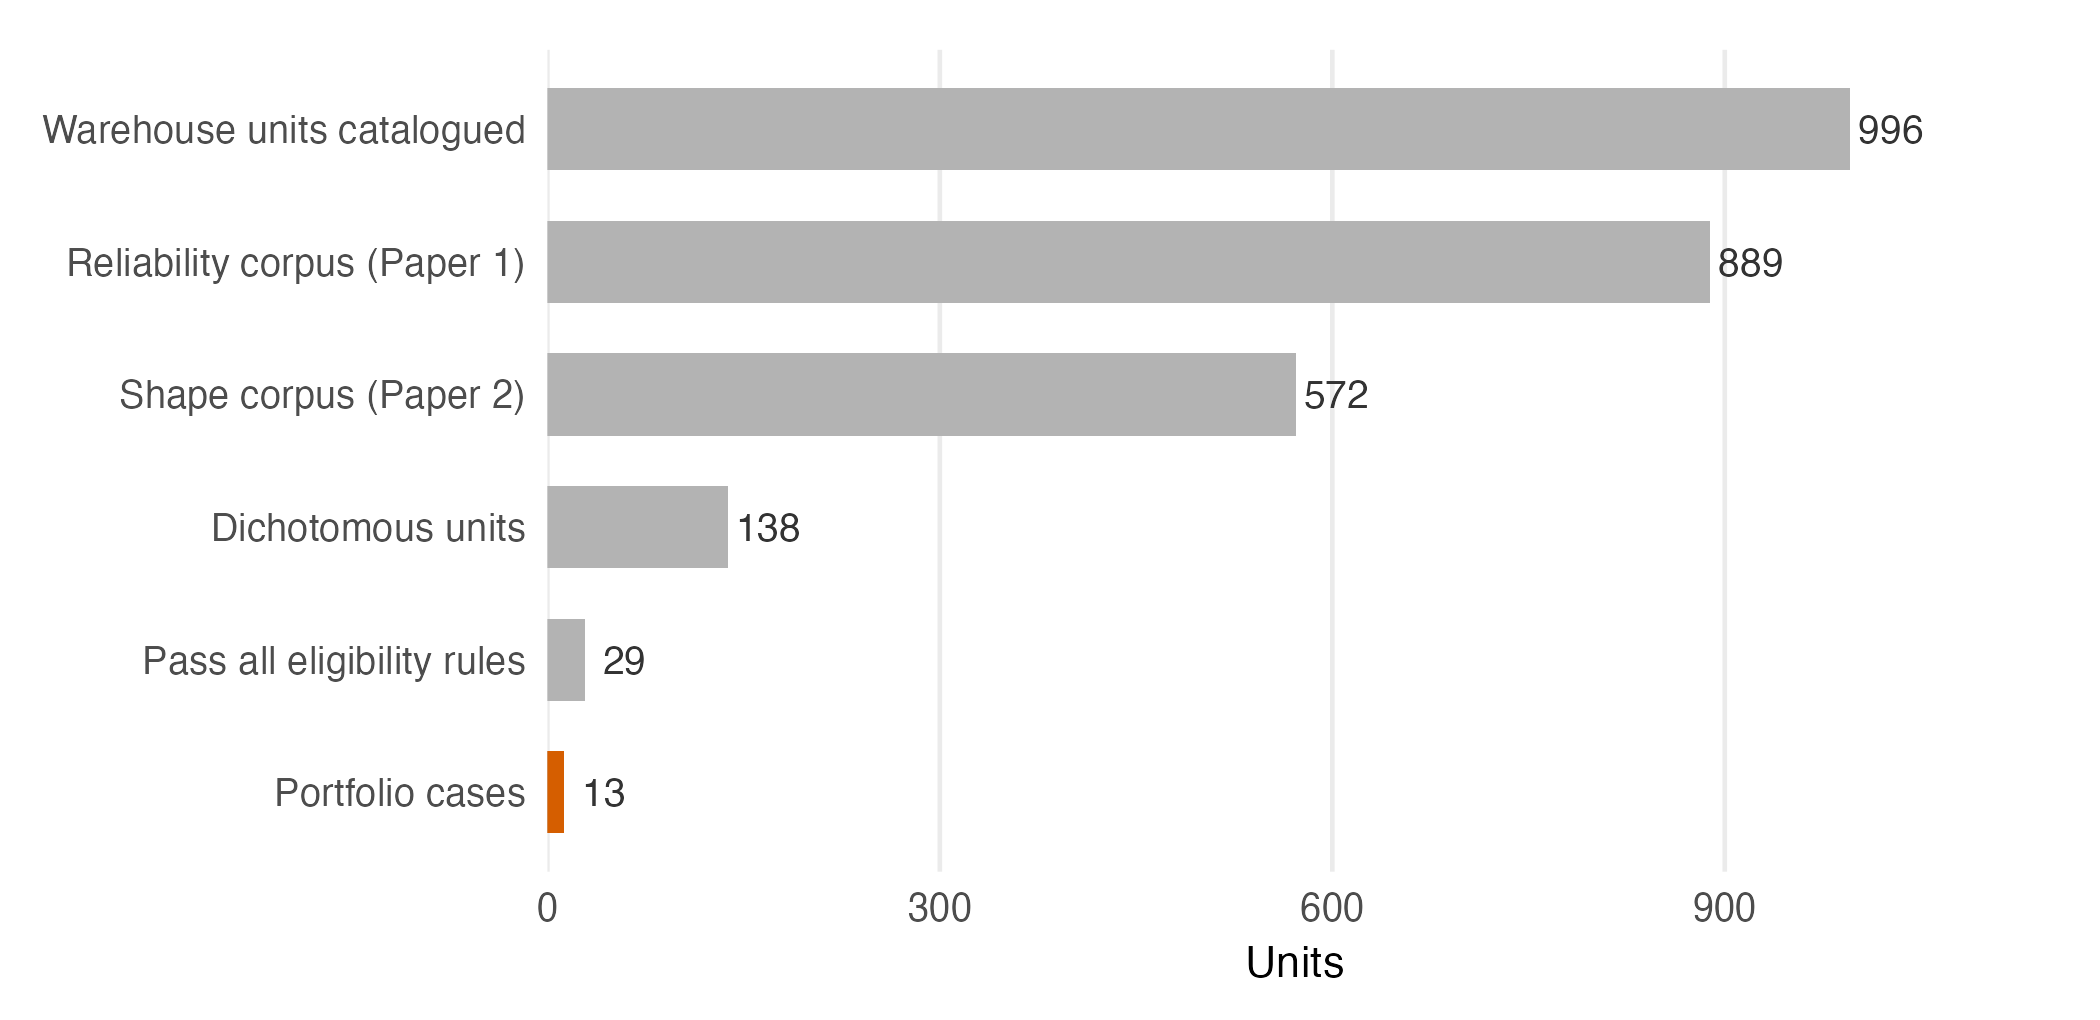
Most of the attrition in Figure 4.1 is structural. Two earlier corpus papers of this project supply the screening measurements: a reliability audit covering 889 units (Lee, 2026b) and a latent-shape audit covering 572 (Lee, 2026a). The single largest cut is dichotomy: the DPMirt item models fit binary responses only, which removes roughly three quarters of the shape corpus and leaves 138 units. Seven eligibility rules then screen for a single administration, at least a thousand respondents, 12 to 60 items, approximate unidimensionality, a converged empirical-histogram fit, and a plausible response-matrix density, leaving 29 units eligible for the characterized tier. The portfolio adds three small datasets fitted whole (their own tier, with the screen relaxed) and two deliberate low-reliability recruits, for reasons the next section makes concrete.
Two properties of the corpus deserve the reader’s suspicion before any result. The warehouse over-represents shareable data: internet samples, volunteer panels, and instruments whose licences permit deposit, while high-stakes operational testing is nearly absent (one case here, the Brazilian ENEM, is the exception). And it over-represents clean data, because depositors curate. Both biases limit coverage claims, neither touches internal comparisons: every contrast in Part IV is within-dataset, so the samples’ unrepresentativeness cannot manufacture a difference between two methods applied to the same people.
4.2 Where real tests live
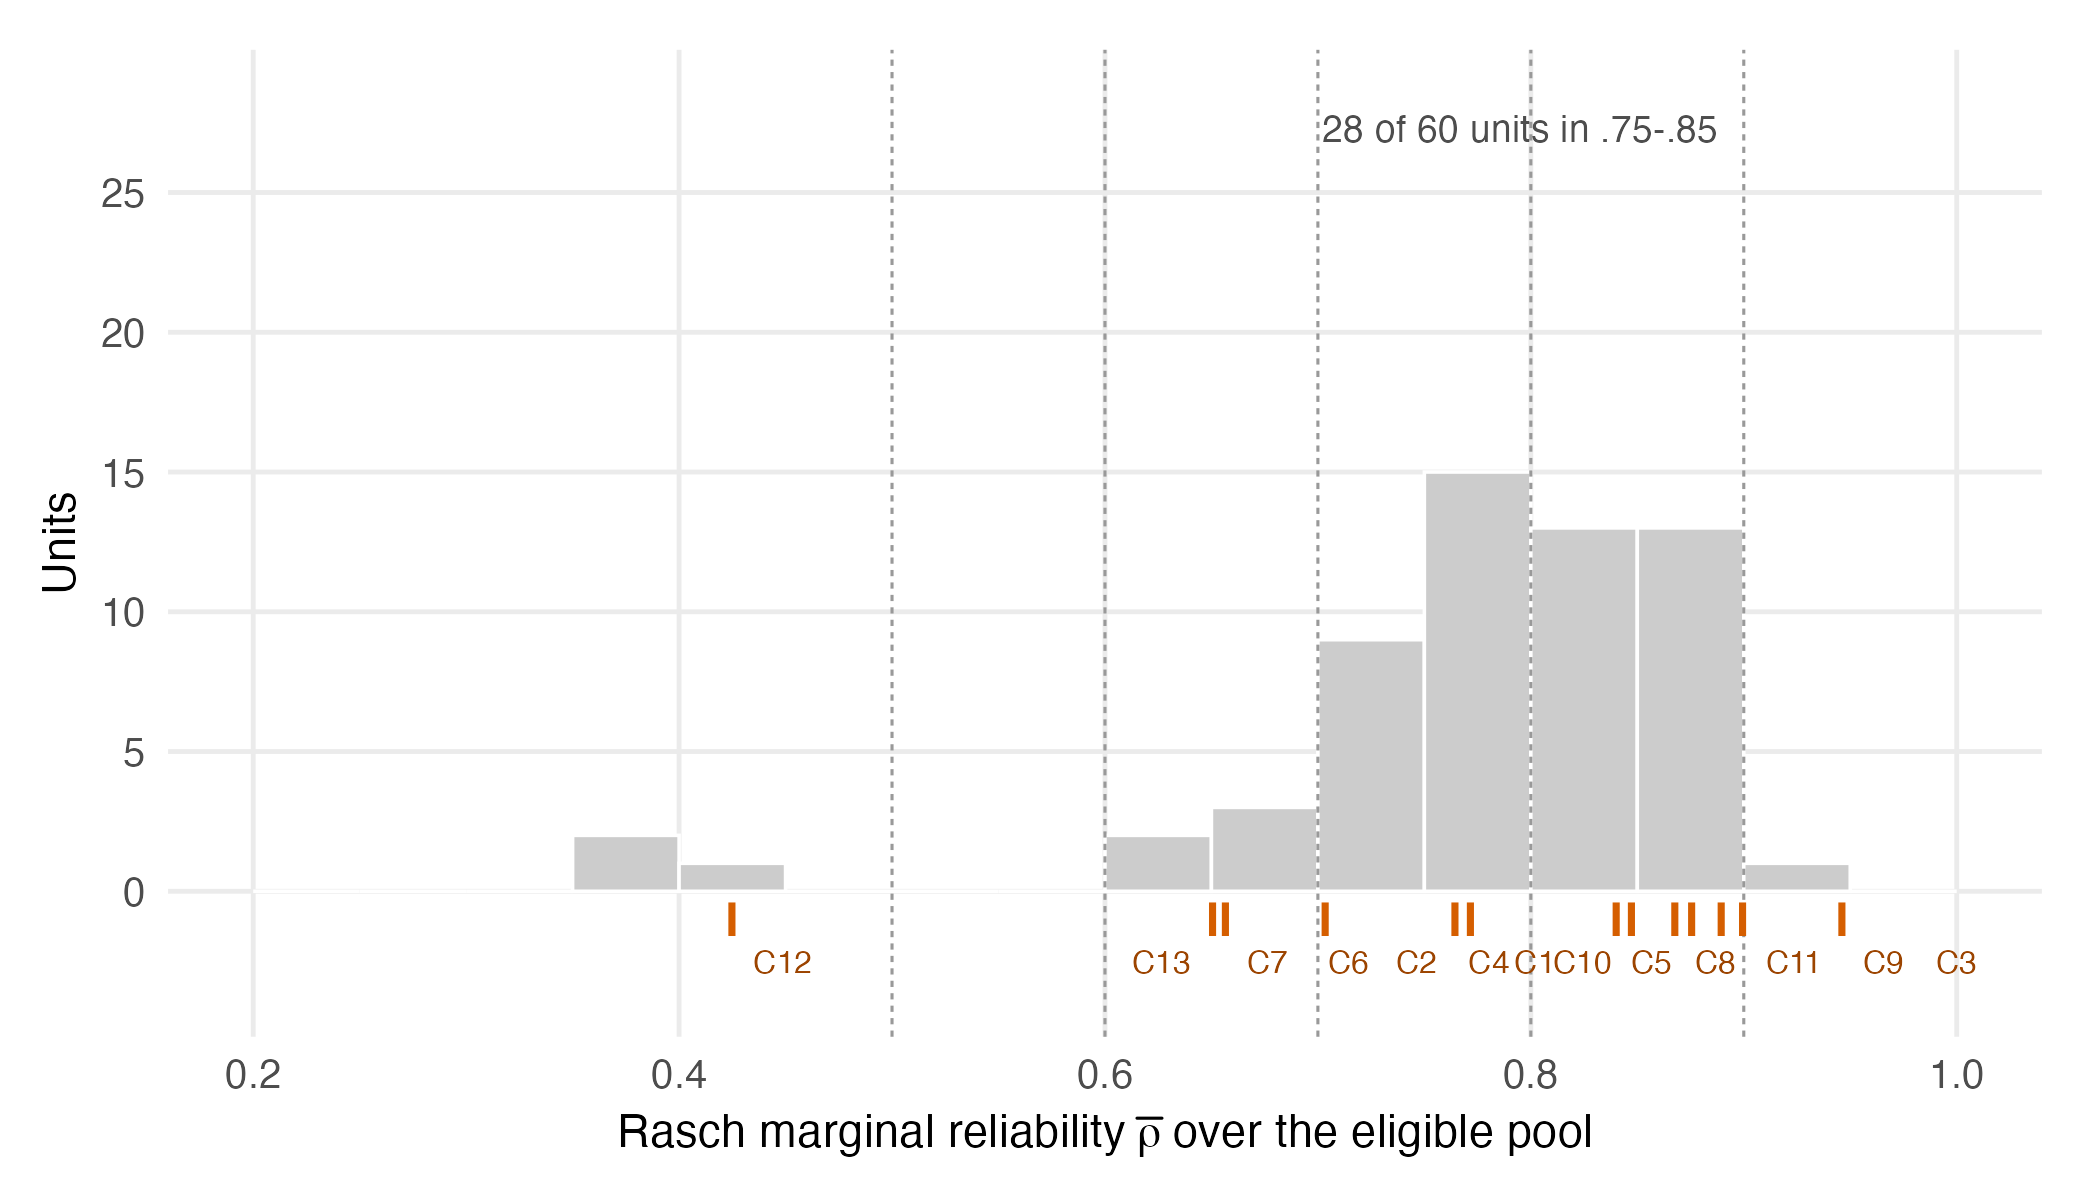
The corpus concentration matters to anyone who wants to use the simulation’s grid, because the grid is uniform and reality is not. Figure 4.2 places the screened pool on the reliability axis: of 60 screenable units, 28 sit in the .75–.85 band and only 6 fall below .65, several of those pathological. The simulation spends two of its five tiers below that line. A reader should therefore expect the high-reliability rows of the simulation’s maps to do most of the work on real tests, and should treat its \bar\rho = .5 row as covering a rare and often broken corner of practice, a point the portfolio’s one inhabitant of that corner (C12) will make vivid.
4.3 Licences and identification
About a third of the corpus carries no usable licence field. Catalogue status needs more precise language: 149 of 996 units (15%) are actually provisional_grade_b, while 538 (54%) carry the accepted-but- ambiguous status accepted_ambiguous_v1_1. The portfolio prefers core-status units but does not require them (two cases are provisional, and say so in their dossiers). Identification is the quieter hazard. For three of the thirteen cases the catalogue’s own descriptive fields were wrong or empty, one construct field held the title of an unrelated methods paper and an age field read “Non-human”, and the instruments had to be identified from source publications or shipped documentation. The dossiers in Appendix A record, for every case, what the identification rests on. None of this is a complaint about the warehouse, whose harmonization is what made the audit possible; it is a caution that a corpus row is a claim about provenance, not a fact, until it has been checked against the instrument it names.