10 Individual scores
The first output family is the one with a person attached to every number. The question is concrete: whose reported score moves when the prior changes, in which direction, and by enough to matter. The prior contrast here is the focused DP against the Gaussian with the summary held at PM; summary swaps were the previous chapter’s subject, and elicitation swaps are deferred to the noise discussion in Chapter 12 because that is where they surface.
10.1 Where movement lives
The following class-conditioned aggregates use the standardized shape classes of Section 5.4. Median absolute movement is 0.136 SD on the skewed cells, 0.045 on the bimodal ones, 0.039 on the normal controls and 0.024 on the undetermined cells, against the 0.10 SD materiality bar. Skew is the only class above the bar, and Figure 10.1 shows why in the only way a median cannot: movement is not a uniform perturbation but a structured function of where a person sits on the scale.
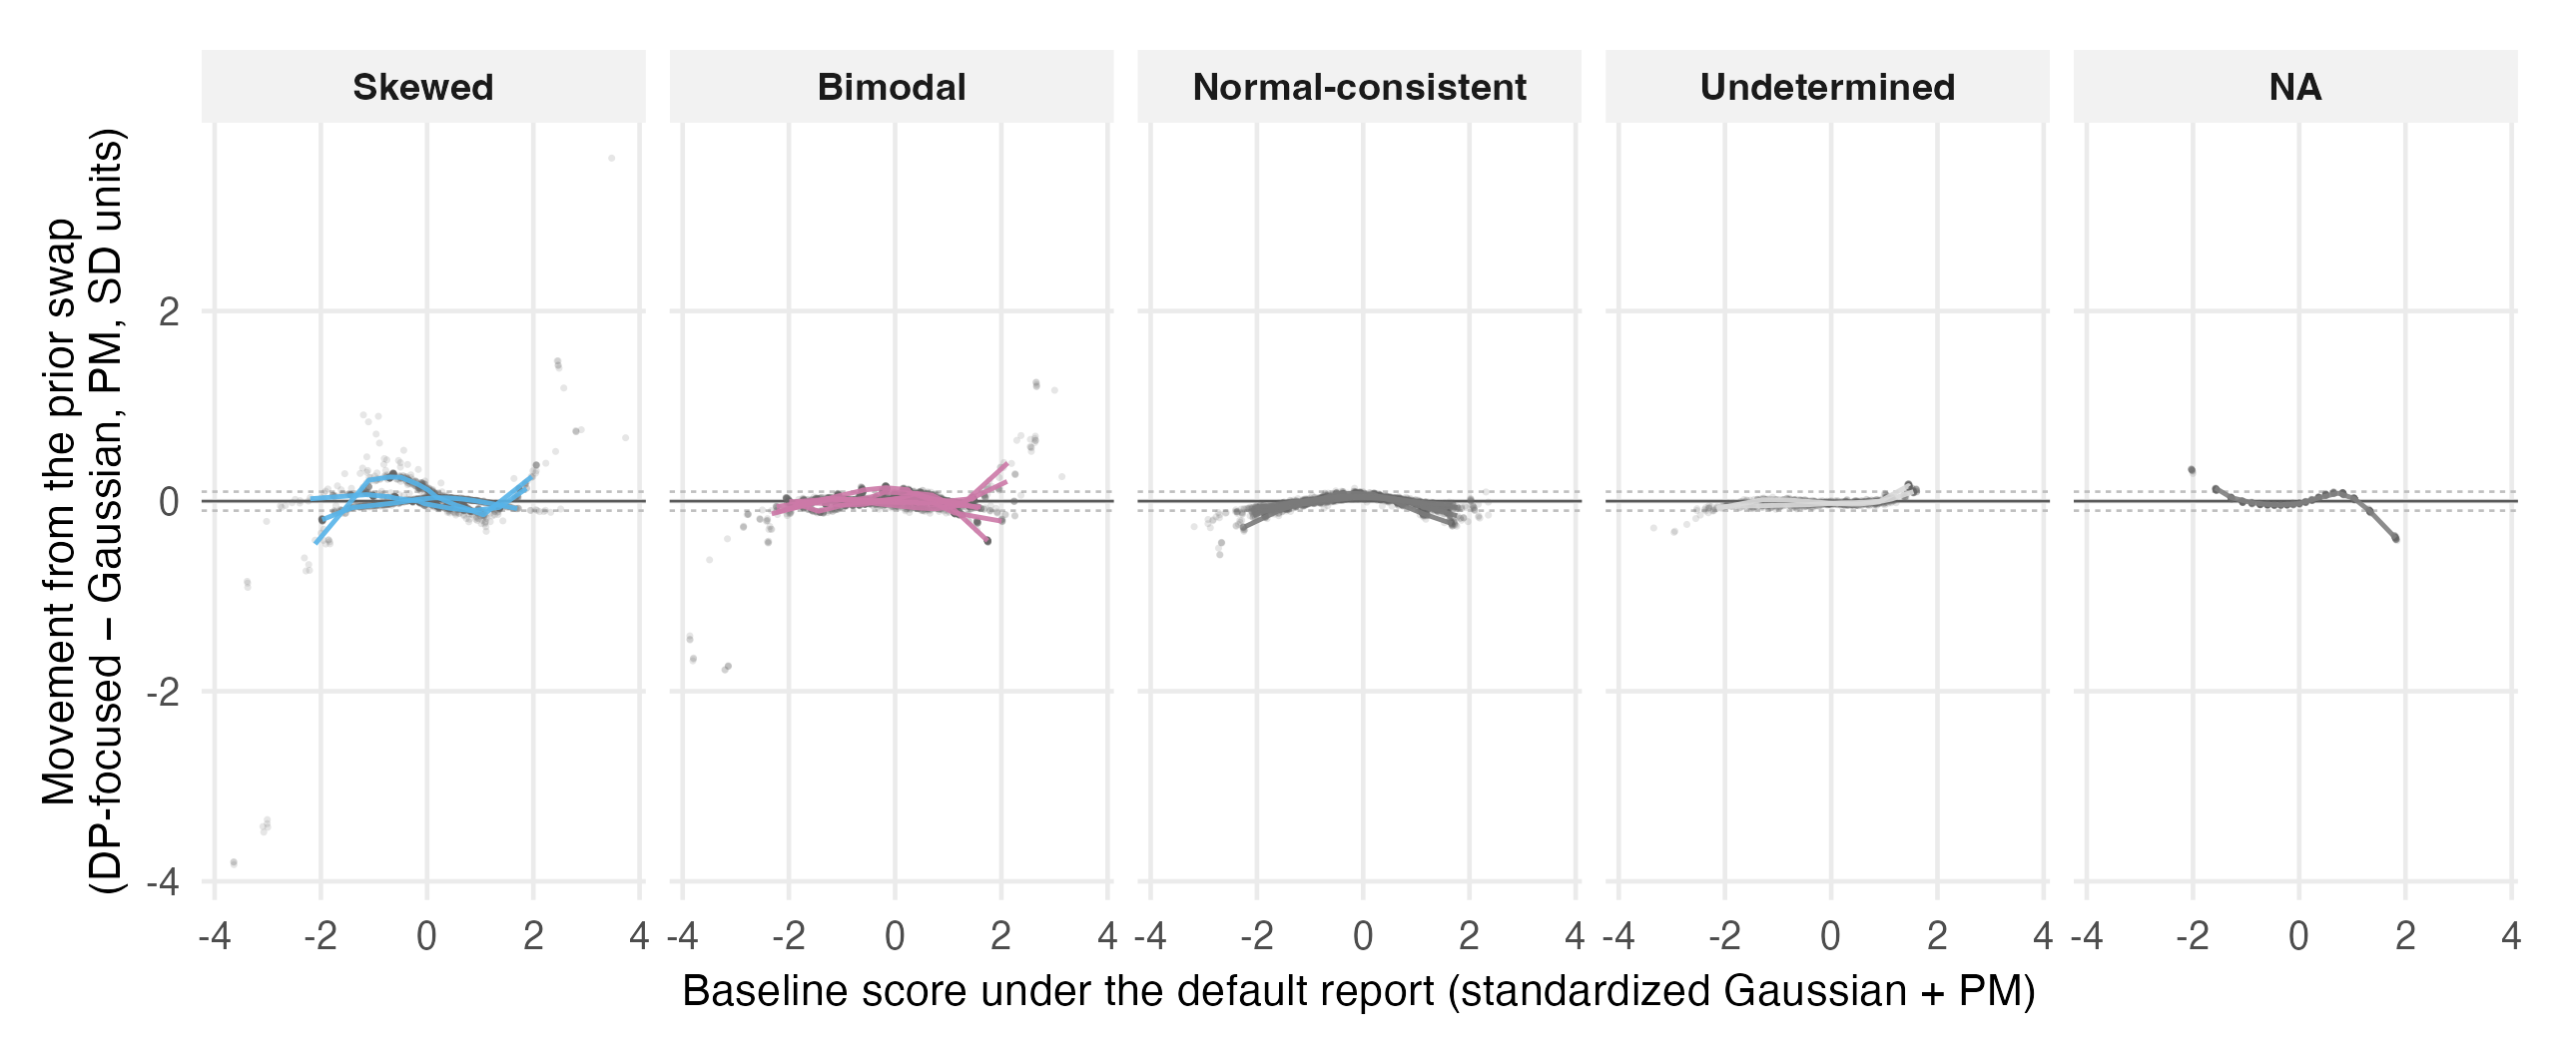
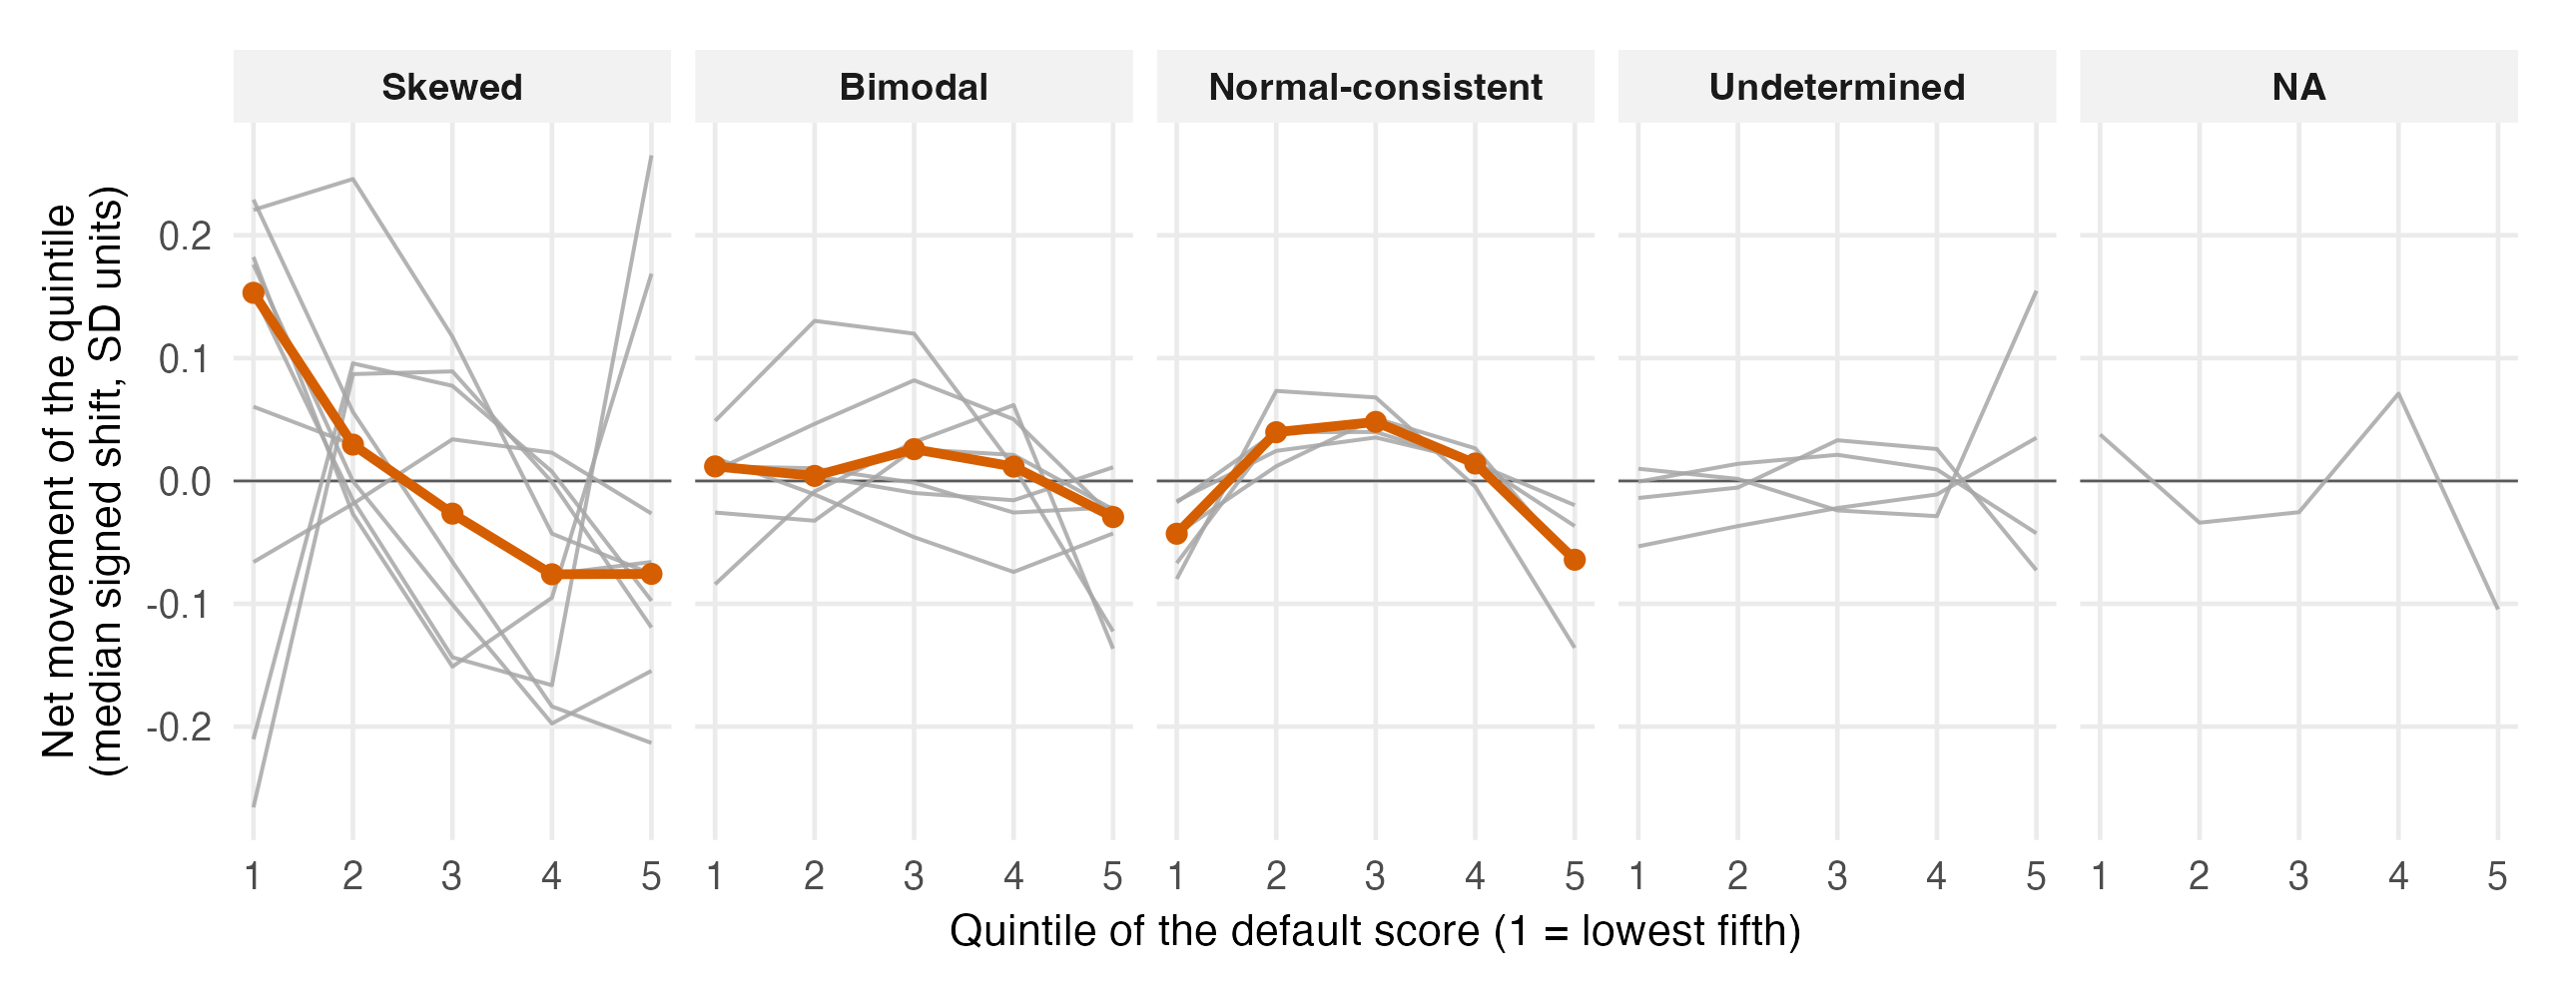
Under skew the per-cell traces bend at both ends: the sparse tail is pulled inward (the flexible prior, having learned that the population thins there, shrinks its stragglers toward the mass) and the dense shoulder is pushed outward. The quintile profiles of Figure 10.2 make the geometry exact: the lowest quintile’s net movement is +0.153 SD and the highest quintile’s -0.076, ends in, middle out. On the bimodal cells every quintile’s net movement stays within 0.029 SD, the flat profile that makes the next chapter’s finding surprising. The normal-control profile is the registered exploratory observation E-02, not a settled claim. It is small but distinguishable from measured seed variation: its largest quintile net is 0.064 SD, an order of magnitude above the measured Monte Carlo error (every reported movement in this family runs ten to forty times the sampler noise), which is the materiality-versus-distinguishability distinction of Chapter 3 in action. Quiet means sub-material; it does not mean zero, and a reader who needs the flexible prior to change nothing at all on a normal population is asking for more than any sampler can promise.
10.2 Size of departure does not predict size of consequence
The natural expectation, written into the first edition’s blueprint, was that the farther a population departs from normal the more the prior matters. The portfolio contradicts it. The bimodal cases depart farther, 1.43 times the simulation’s own bimodal condition on the departure scale, against 0.80 for the skewed cases, and move a third as much. Within class, departure size predicts nothing (correlations of -0.05 and +0.03). Figure 10.3 displays the double dissociation.
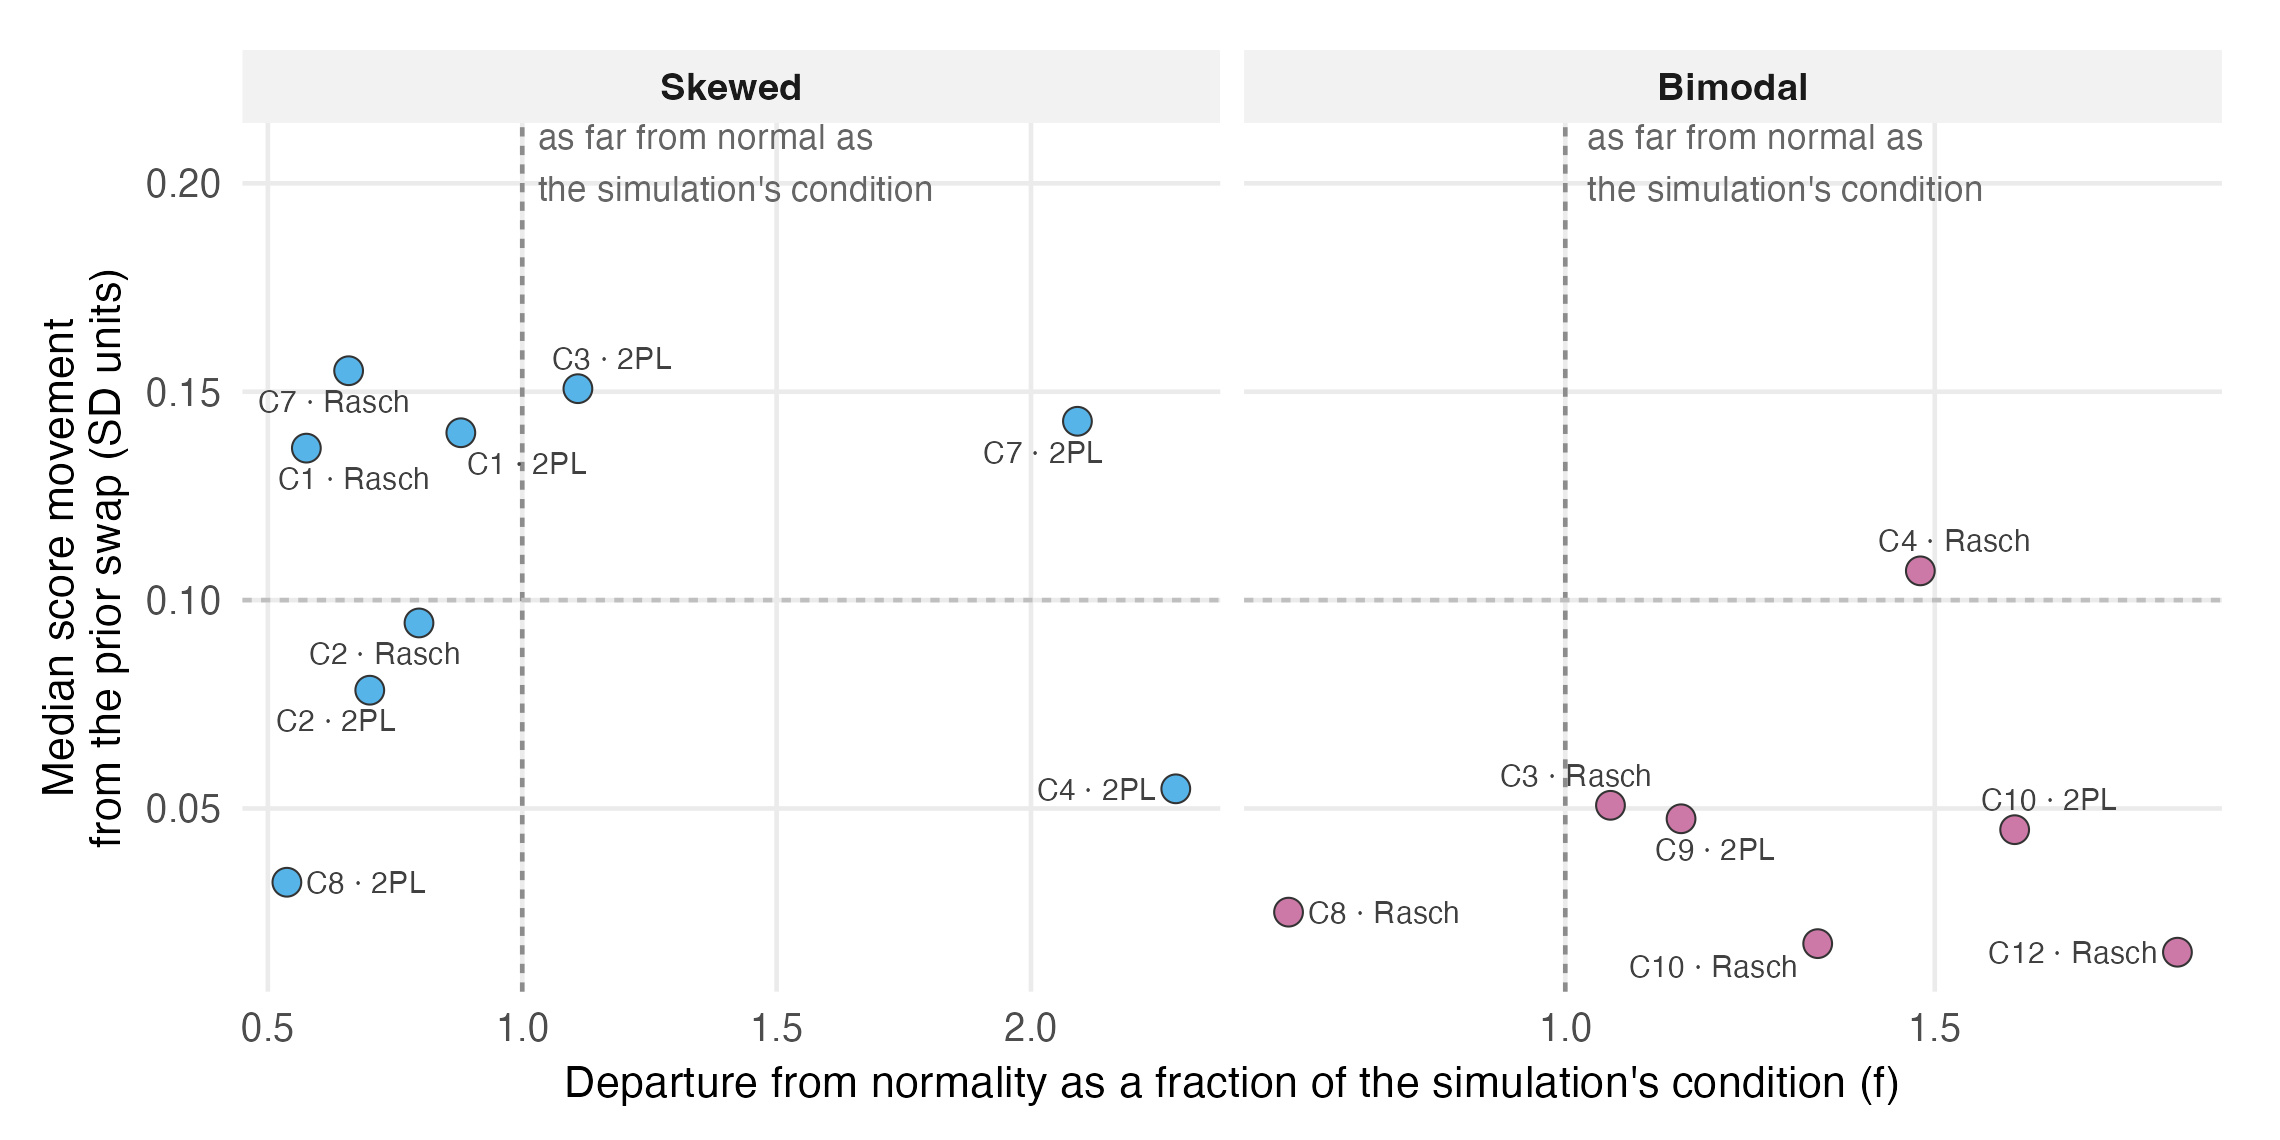
One interpretation, consistent with the simulation, is as follows. A skewed density disagrees with the normal about density nearly everywhere, so learning it moves posterior means throughout the scale. A bimodal density of moderate separation agrees with the normal about the center of mass and disagrees mainly about a valley; at these reliabilities each person’s likelihood is too wide to assign them firmly to a mode, so the posterior mean, which averages over that uncertainty, barely moves even while the estimated population density changes a great deal. What bimodality changes is not where people are put but what curve their positions are read against, and that is the next chapter.
10.3 What this family establishes
Conditional on the standardized shape classes, individual scores move materially only in the skewed group and show an ends-in, middle-out pattern. Movement is unrelated to the stored departure magnitude within class, so a shape statistic’s magnitude is not a license to expect large score changes. The normal-control structure is E-02 and remains exploratory. Nothing in this family yet touches the question most analysts would ask first, whether those movements accumulate into different decisions; they mostly do not at the individual level, and they do elsewhere, which is the point of reporting by family.