12 Rankings and selection
The third family is the ordering: who ranks above whom, and who makes a selected group. It is the family where aggregate statistics mislead most reliably. It is also where the independent A/B refit gives an essential reference for interpreting method contrasts.
12.1 The correlation that conceals everything
Every between-prior rank correlation in the portfolio exceeds 0.996. Reported alone, that number would close the family: the ordering is preserved, nothing to see. It conceals two facts. First, small rank movements are the norm, not the exception: under skew, 50% of respondents move more than one percentile point. Second, selection operates at cuts, and cuts aggregate small movements into membership changes: on the bimodal cells the prior swap changes about 10% of a reported top decile (top-decile Jaccard 0.818), about 12% of a top-5% group, and under 5% of a top quartile: the tighter the cut, the larger the churn. So the bimodal cells, quiet in scores, are loud in selection, the second half of the dissociation Chapter 9 mapped.
12.2 The paired seed reference
Before attributing churn to the prior, the design measures the churn in one paired refit of the identical method. Re-running it with a new seed changes 2.0% of a top decile on the skewed cells, 4.0% on the normal-consistent rows, 6.2% on the bimodal cells, and 2.1% on the undetermined ones, a stratum the first edition’s headline range omitted. In the worst single cell the same method agreed with itself about only half its selections. Across the three PM prior arms, the worst bimodal overlap is 0.556, or 29% churn. Across all nine prior-summary combinations the exact top-k maximum is 32.0% (minimum Jaccard 0.515). The Gaussian-PM subset in Figure 12.1 has a separate maximum of 28.0%. The figure puts every case-cell’s prior churn against its own seed churn.
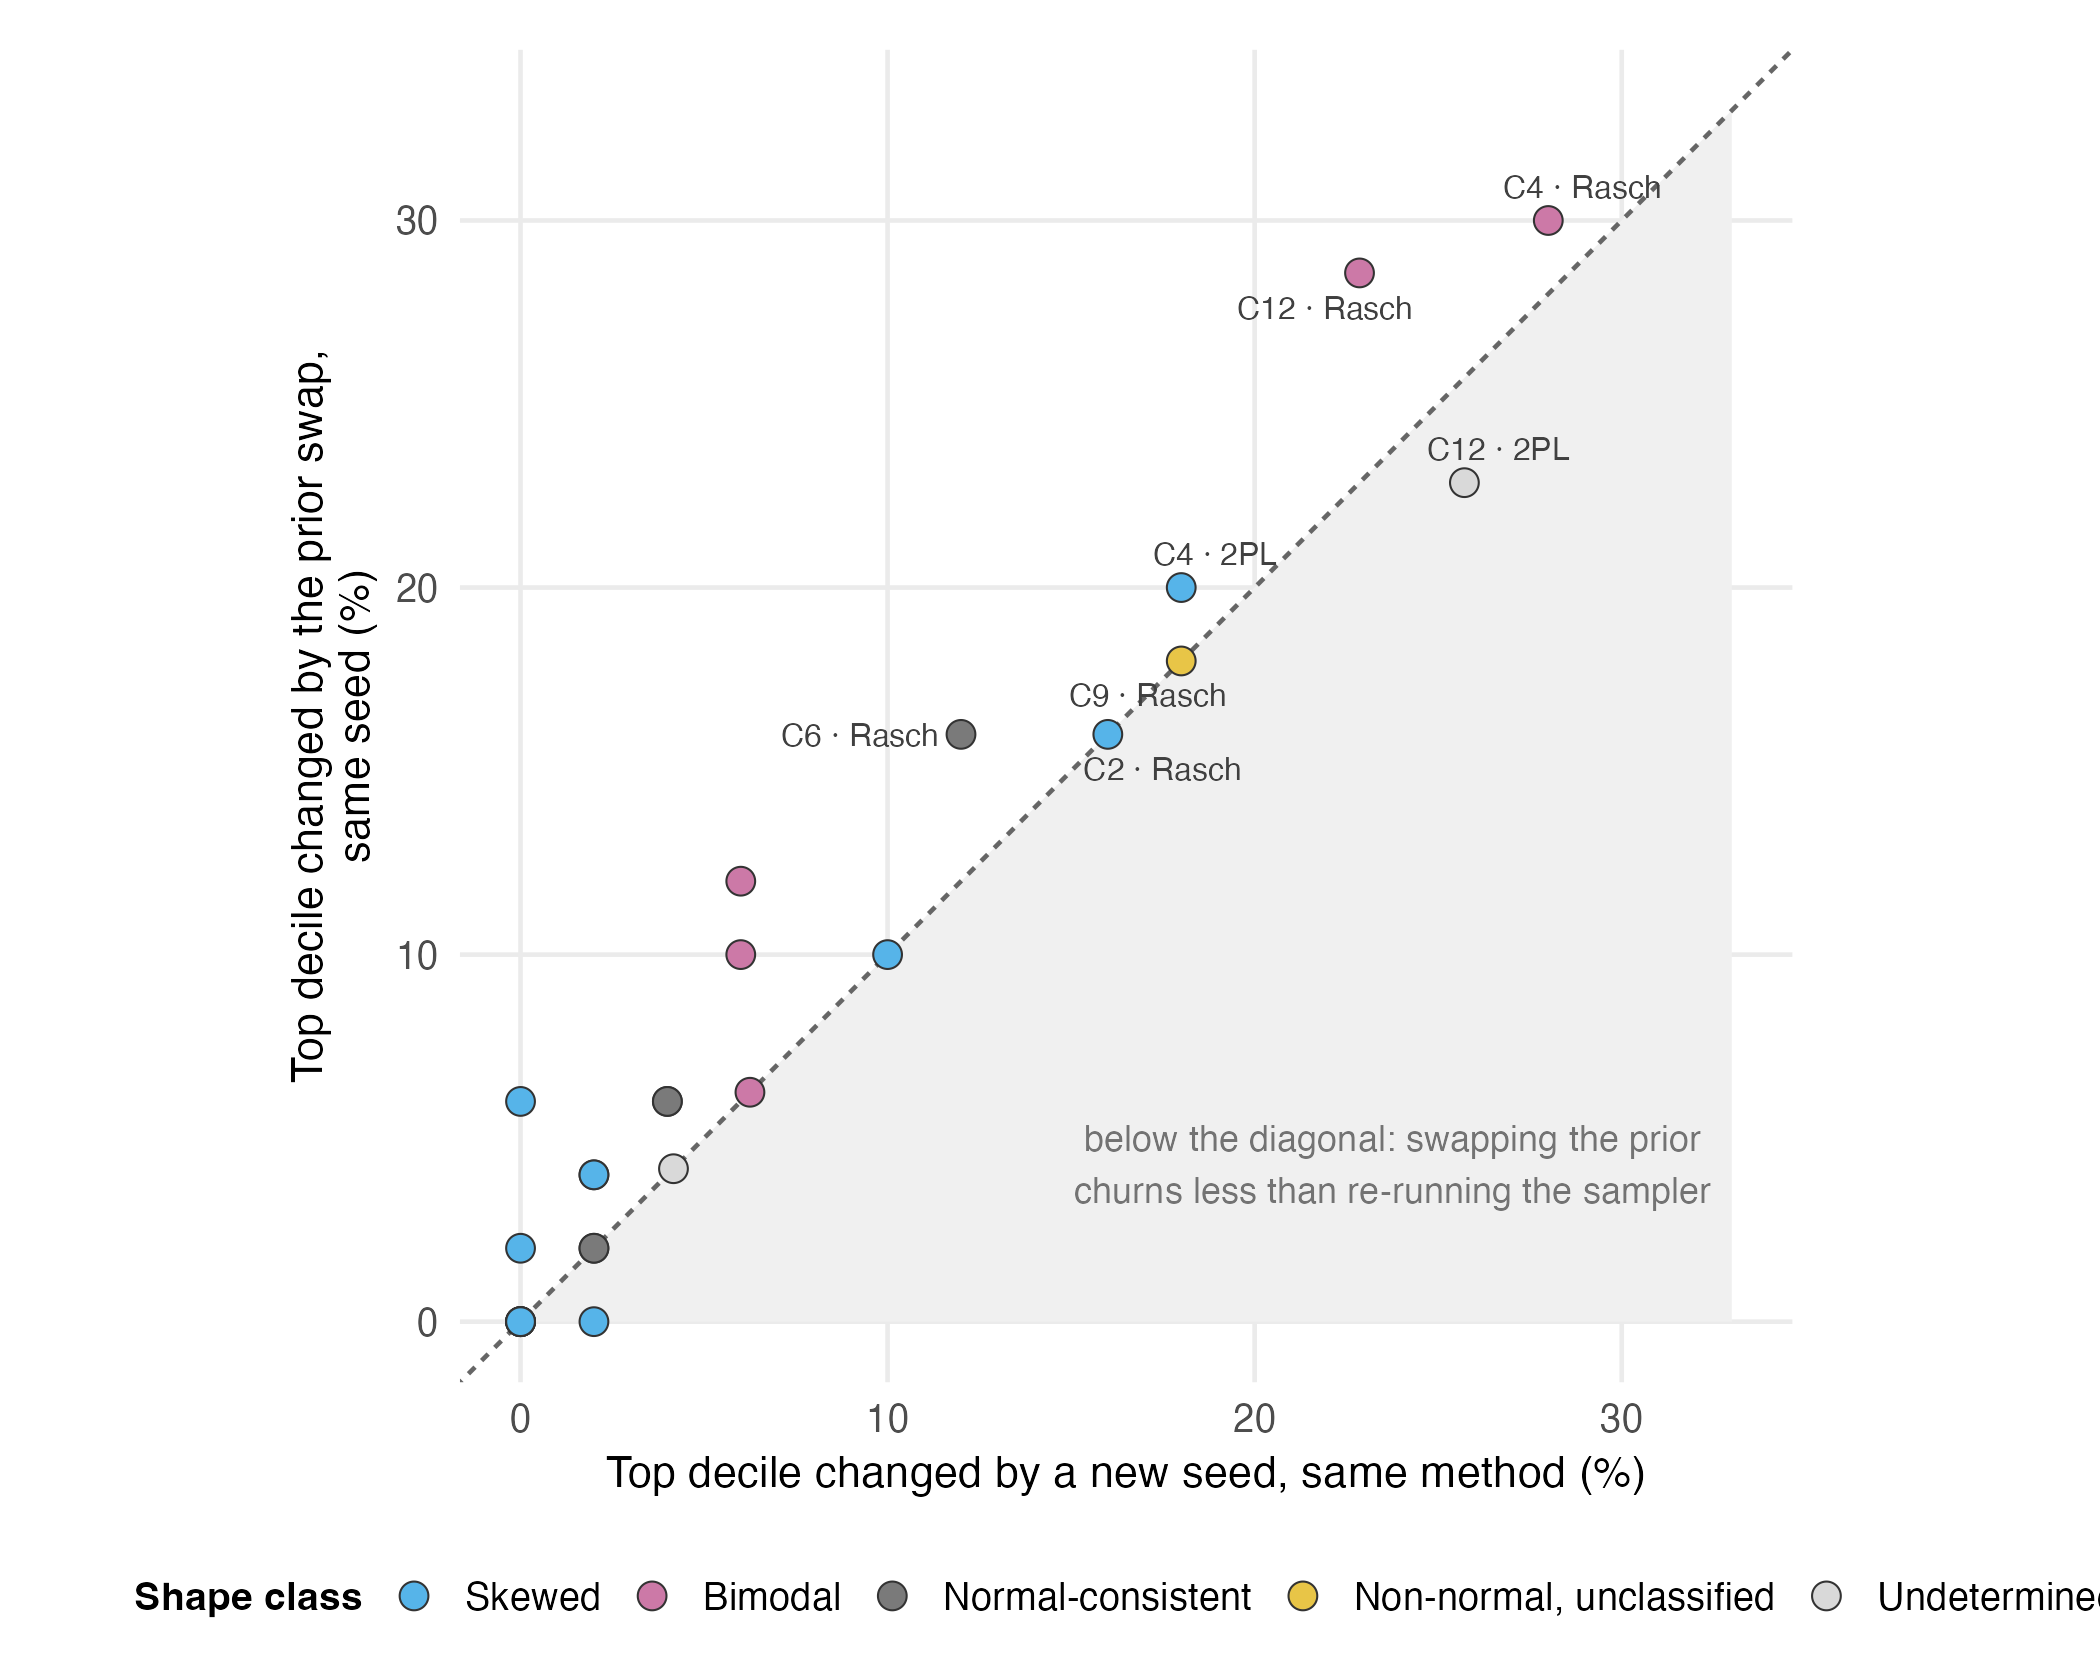
The reading is not that selection is meaningless; overlap remains far above the chance benchmark (raw agreement near 98% against a chance level near 82%, with chance-corrected agreement lowest on the bimodal cells at 0.889). The reading is that a reported top decile carries seed-dependent variation before any methodological question is asked, and that method effects should be compared with that paired refit. Because there is only one A/B pair per cell, it does not estimate a seed-to-seed uncertainty interval or establish a universal lower bound. Figure 12.2 applies the standard to the three available perturbations.
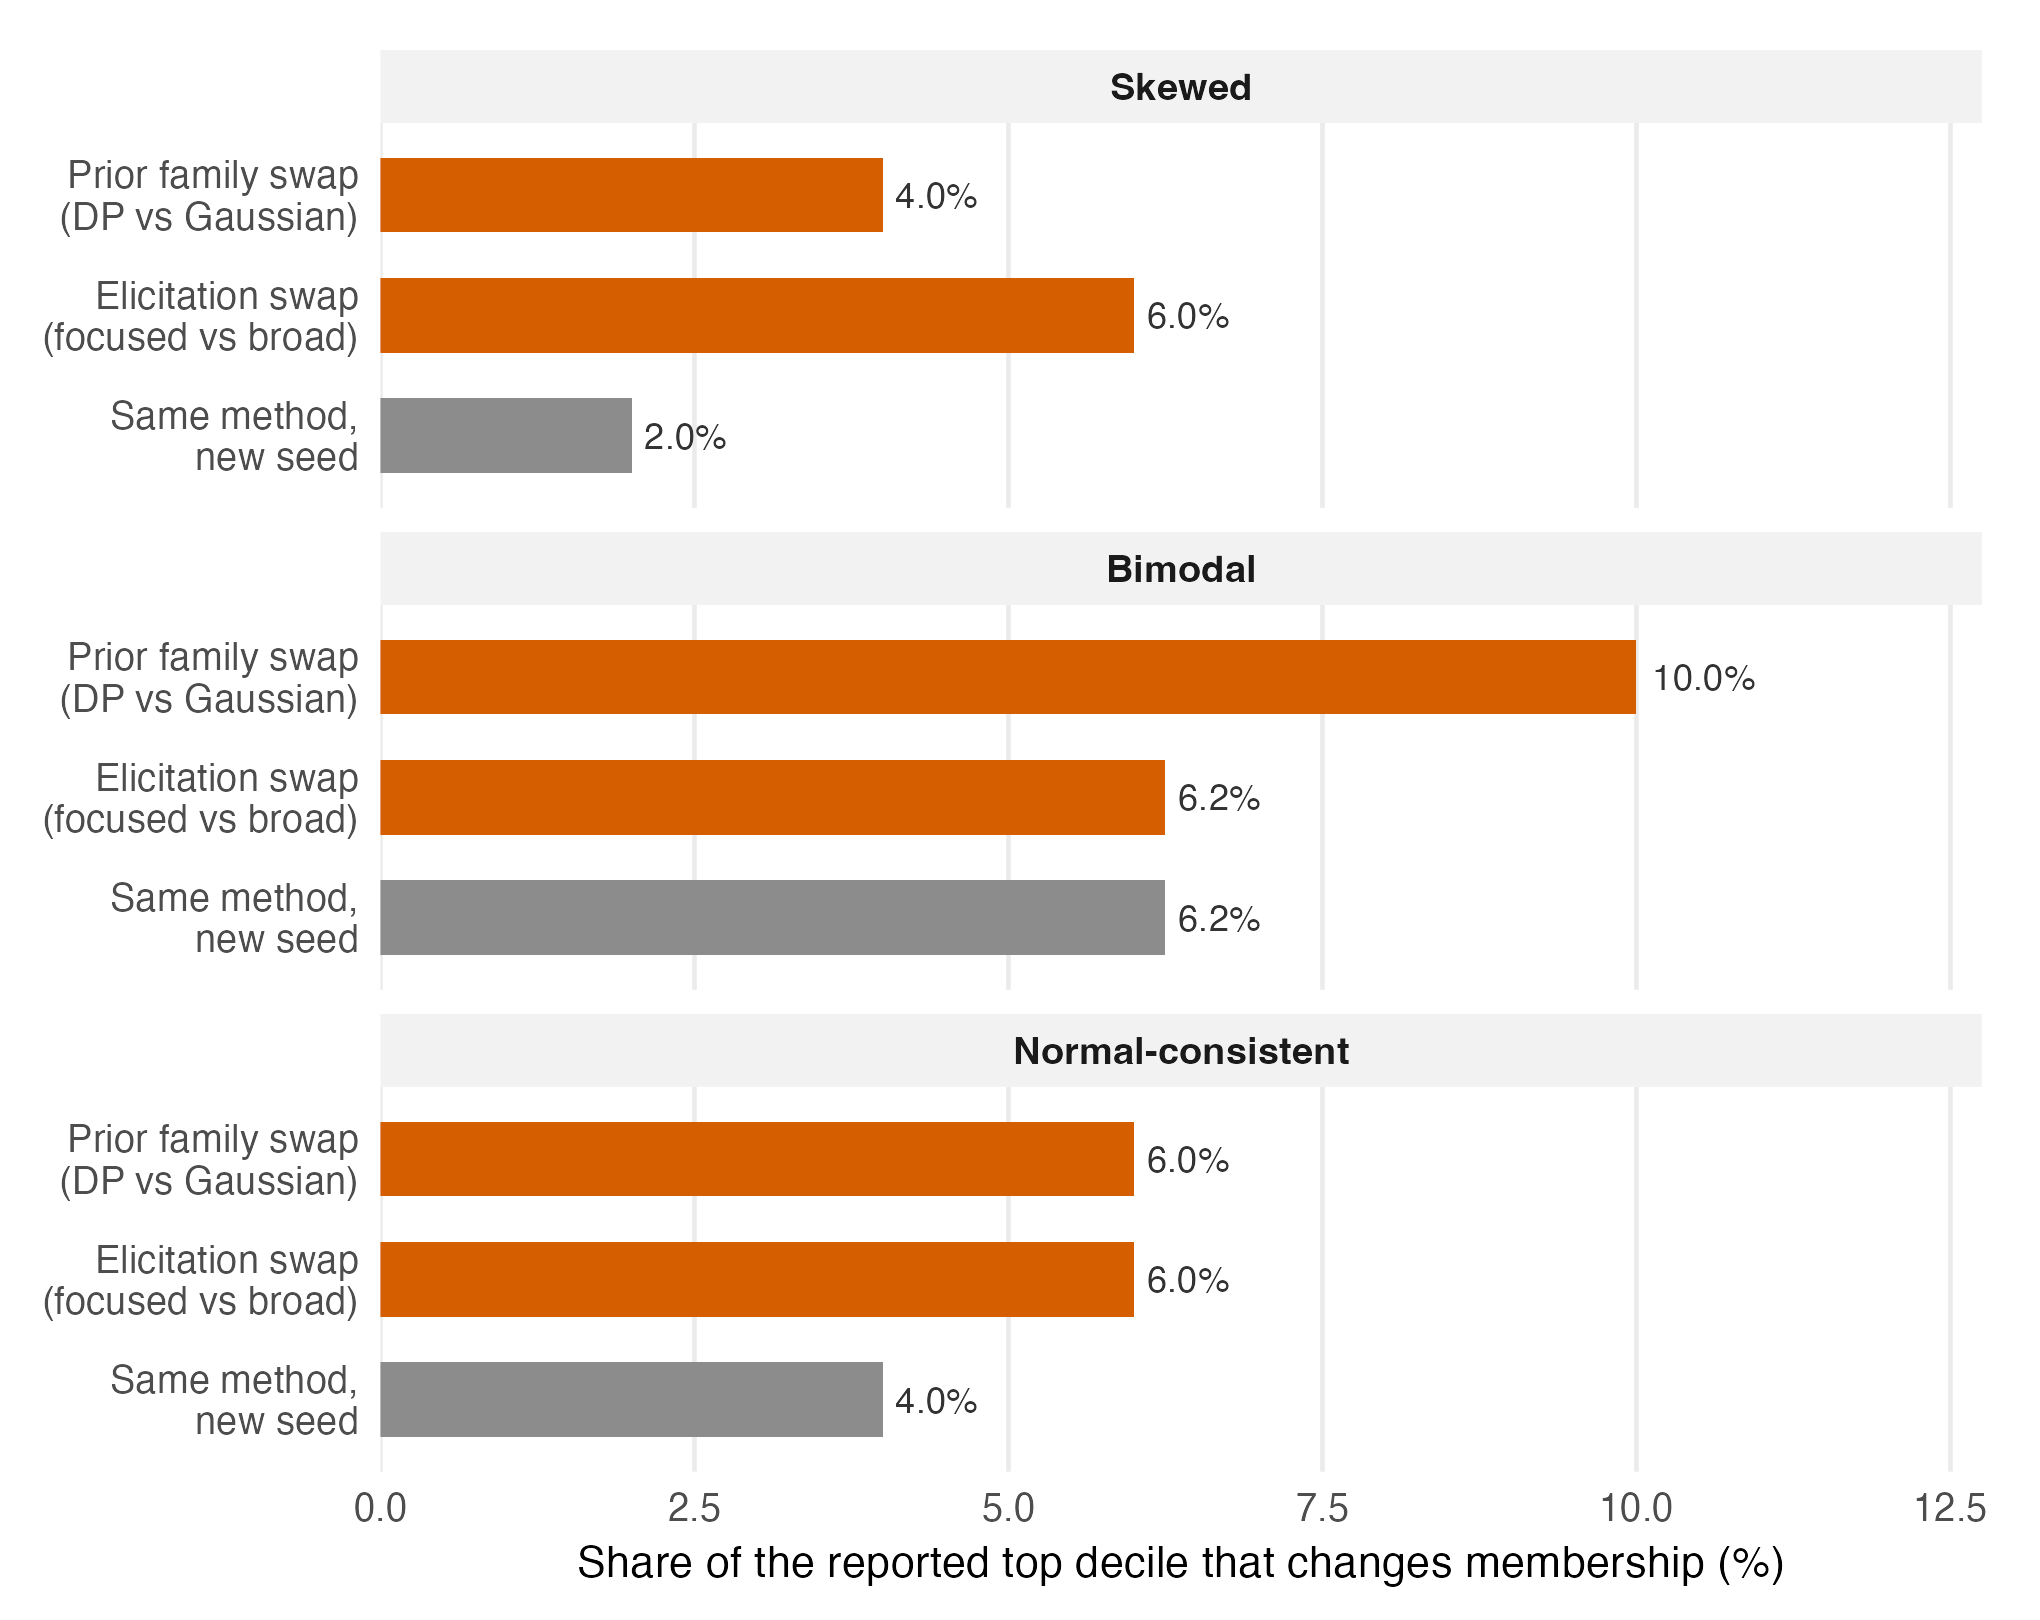
Only the prior-family swap on bimodal cells (10.0% against a 6.2% paired seed comparison) clearly exceeds its seed comparison. The elicitation contrast, focused against broad, is 6.2% on the bimodal cells and exceeds the prior-family contrast on the skewed ones (6.0% against 4.0%), an pattern the first edition displayed without remark. Where the prior family barely reorders anyone, the two near-equivalent elicitation settings still produce measurable membership differences. This is also where the elicitation question, deferred from Chapter 10, gets its answer: on scores, distributions and tails the two elicitations are near-identical (median score movement under 0.01 SD; the frozen side-by-side table puts the elicitation’s materiality at 4 of 78 fits on scores against 22 for the prior family), and their one visible effect is top-group membership churn of the same order as the single paired seed comparison. More seeds would be required to separate those sources by an uncertainty interval.
12.3 Clumps
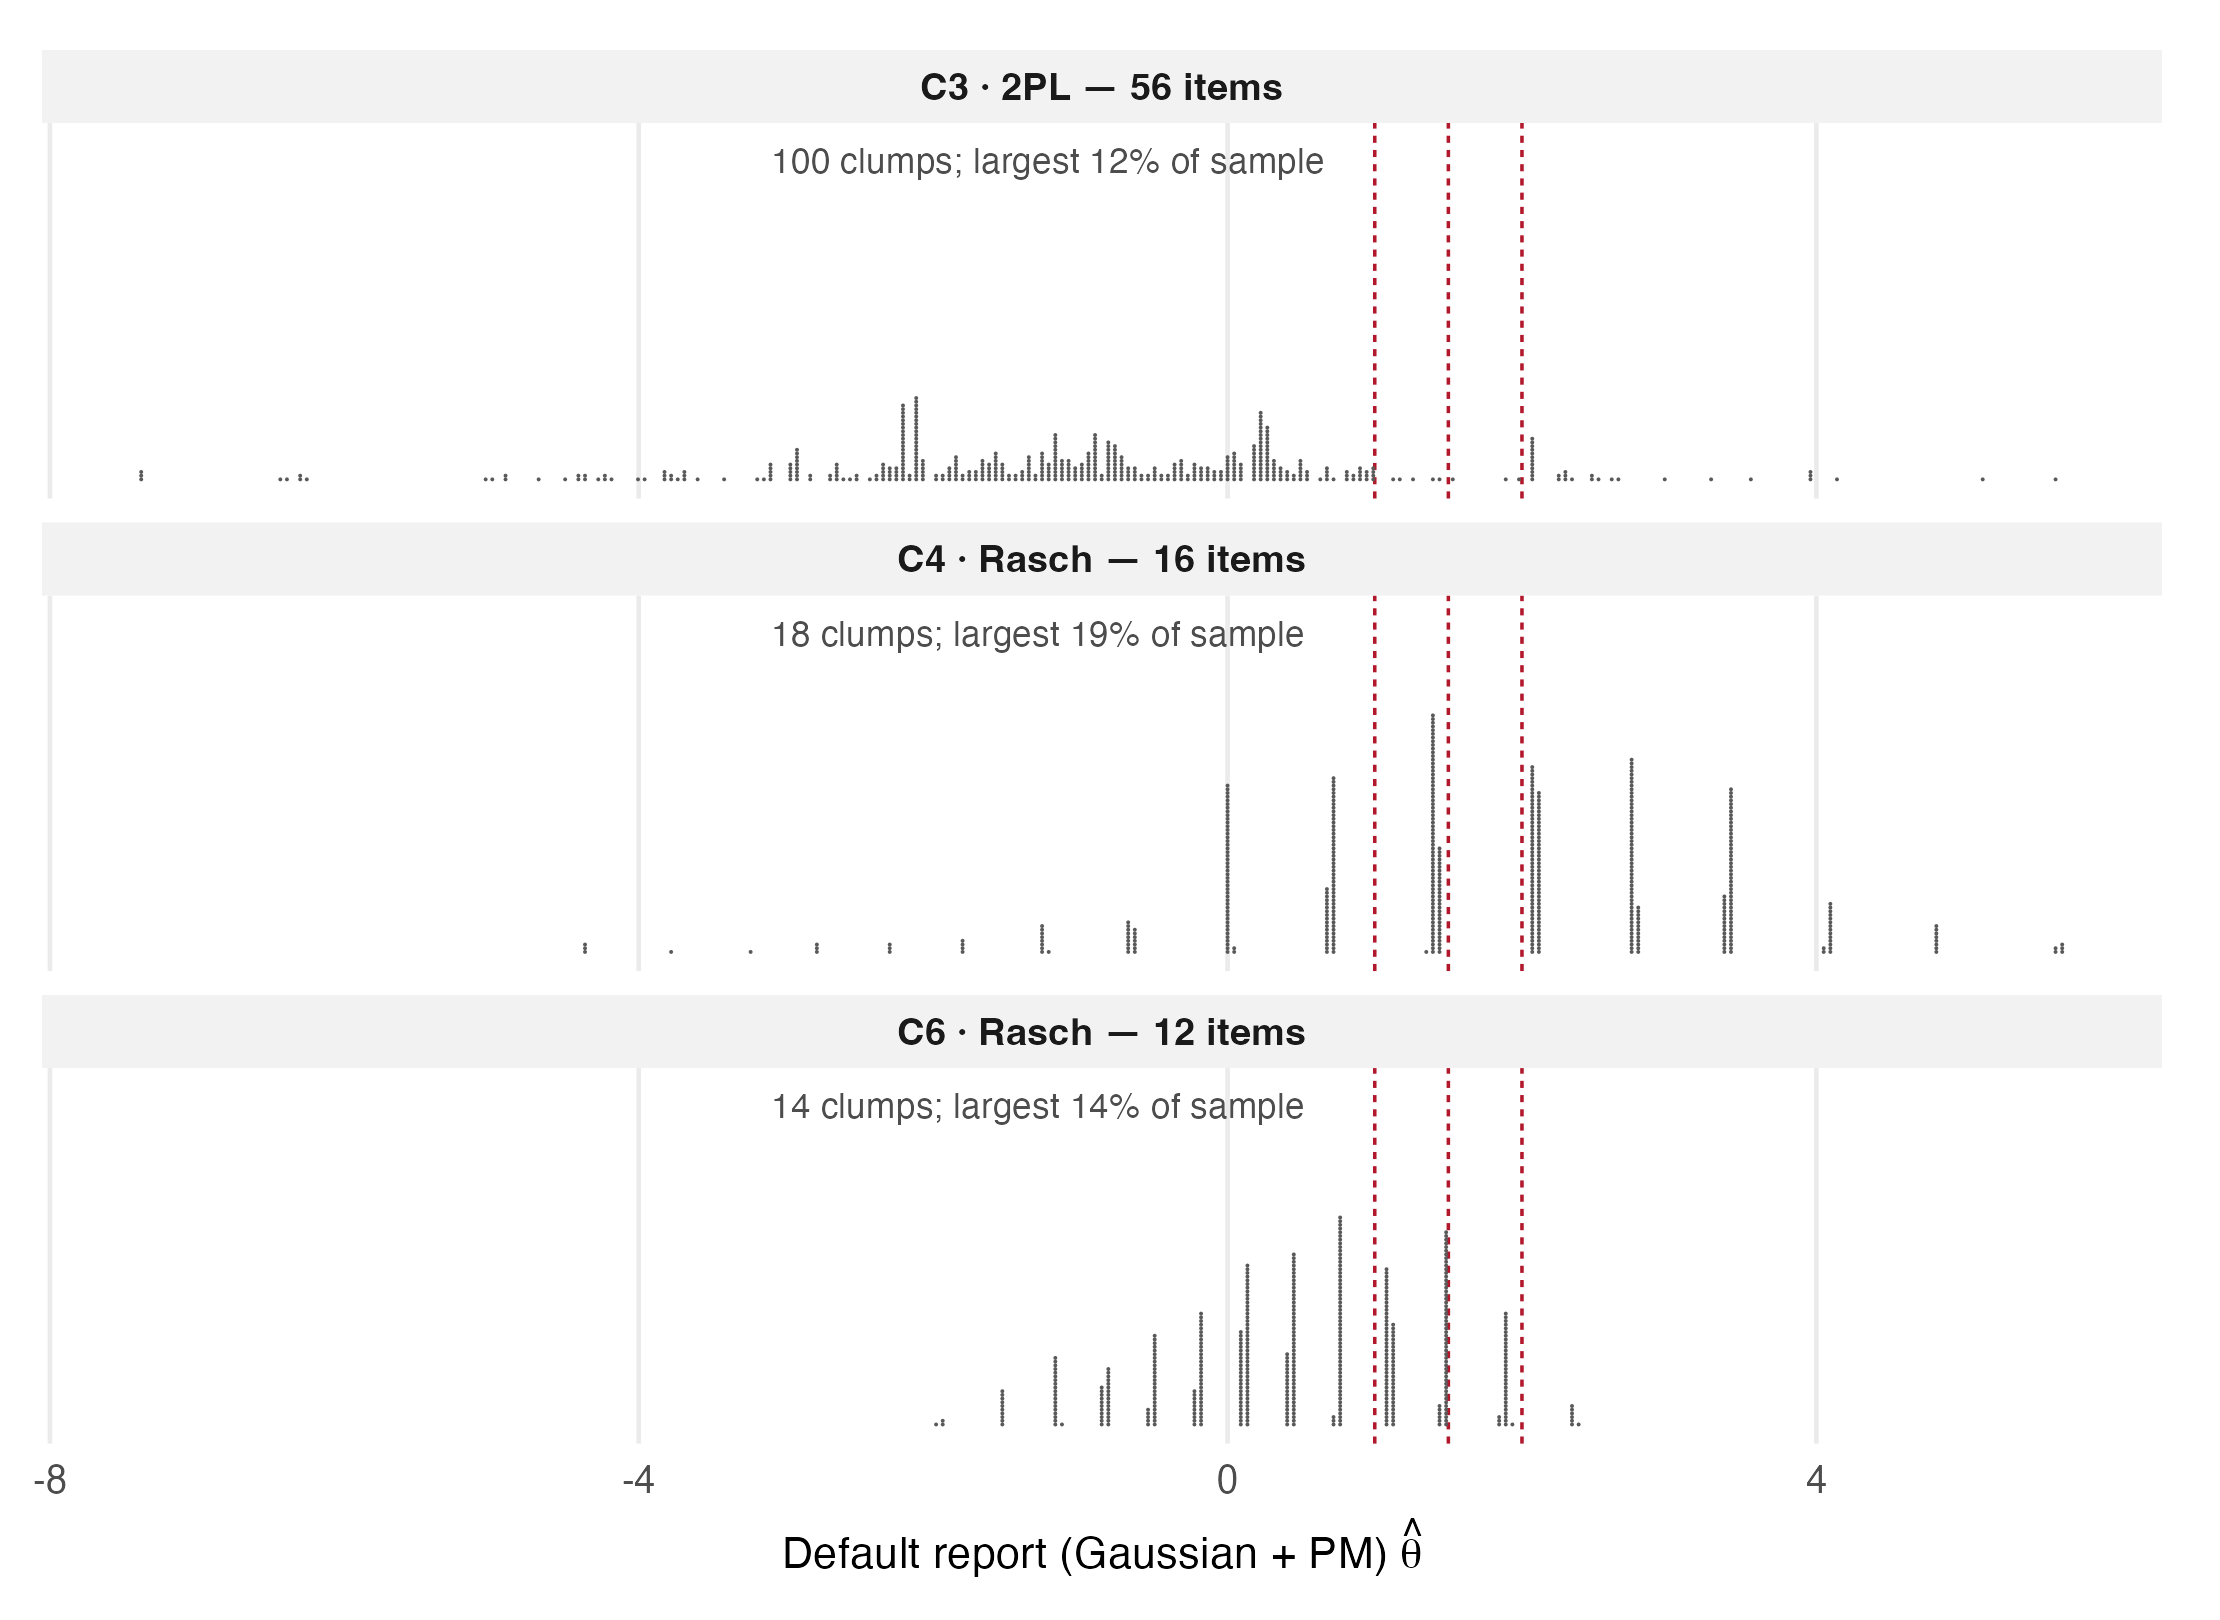
The geometry that makes selection fragile on short forms is visible in the estimates themselves. The stored posterior means are numerically distinct, but short Rasch forms produce dense near-rank bands associated with limited raw-score information. Using the preregistered 0.02-gap definition, the default report’s scale is a set of bands: on the 12-to-16-item cells the median count is 14 clumps with the largest holding 16.2% of the sample. Figure 12.3 shows three scales side by side. A band does not imply exact ties: it marks many nearly indistinguishable estimates packed into a short interval. Small refit perturbations can reorder people inside the band, and a cut through it can move many memberships together. The consequences for cut-based reporting are the next chapter’s subject, and the display belongs here because selection inherits the same geometry: a top-decile boundary that falls inside a dense band is a boundary drawn through distinctions the fitted report resolves only weakly.
12.4 What this family establishes
Rank correlations near one coexist with selection churn near ten percent, so the correlation is the wrong summary for any decision that operates at a cut. The exact top-k seed audit changes 2.0– 6.2% of a class-median top decile, which supplies a directly measured comparison for method-induced churn. At the class median, only the prior-family swap on the former bimodal rows clearly exceeds the corresponding seed value. The elicitation swap is similar to the seed comparison in that group and somewhat larger in the skewed rows, so it should not be interpreted as a stable selection effect. For a program publishing a selection list, the relevant protocol is to duplicate the intended report and require membership agreement; for GR on a 12–16-item form, Chapter 14 makes that duplicate run mandatory in this portfolio-derived rule.