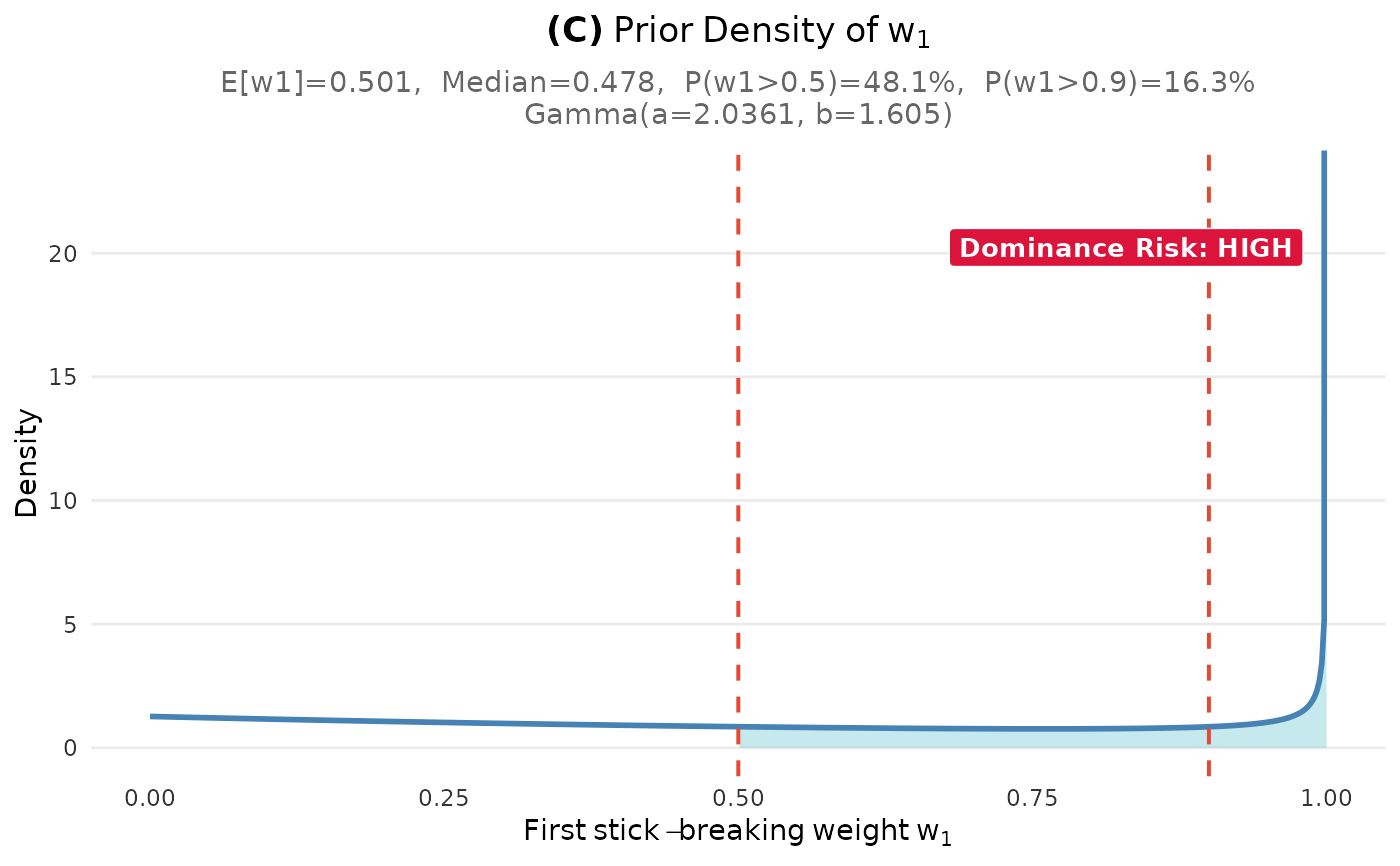
Plot Prior Density of w1
Arguments
- fit
A DPprior_fit object, or NULL if a, b provided directly.
- a
Numeric; shape parameter (used if fit is NULL).
- b
Numeric; rate parameter (used if fit is NULL).
- engine
"ggplot2" (default) or "base".
- base_size
Base font size.
- thresholds
Dominance thresholds (default: c(0.5, 0.9)).
- n_grid
Number of grid points.
- show
If TRUE, print the plot.
See also
DPprior_fit for fitting, plot.DPprior_fit for S3 plot method
Other visualization:
DPprior_colors(),
plot_K_prior(),
plot_alpha_prior(),
plot_dual_comparison(),
plot_dual_dashboard(),
plot_prior_dashboard(),
plot_tradeoff_curve(),
plot_tradeoff_dashboard(),
theme_DPprior()
Examples
fit <- DPprior_fit(J = 50, mu_K = 5, var_K = 8)
#> Warning: HIGH DOMINANCE RISK: P(w1 > 0.5) = 48.1% exceeds 40%.
#>   This may indicate unintended prior behavior (Lee, 2026).
#>   Consider using DPprior_dual() for weight-constrained elicitation.
#>   See ?DPprior_diagnostics for interpretation.
plot_w1_prior(fit)


plot_w1_prior(a = 1.6, b = 1.2)

