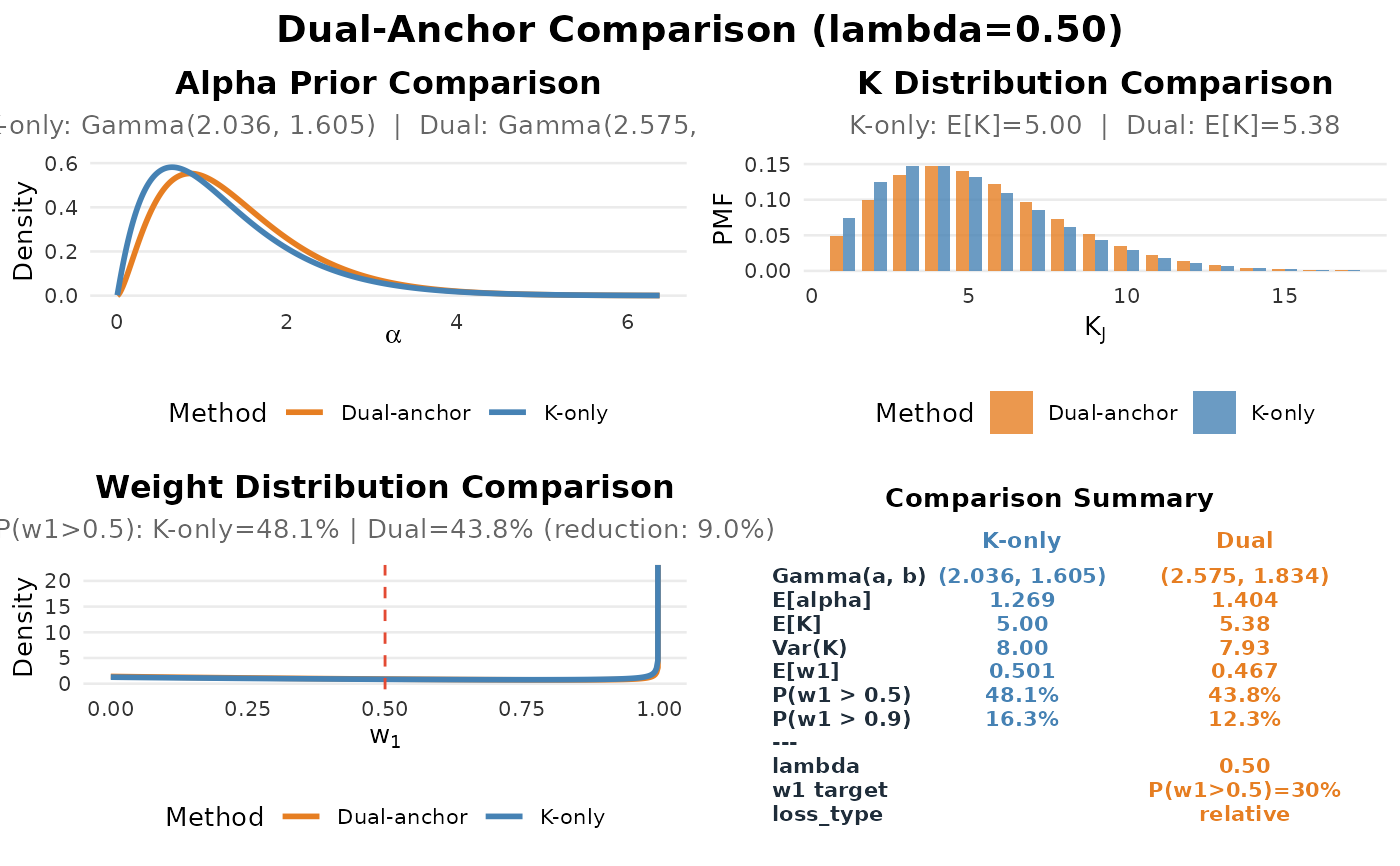
Creates a comparison dashboard showing K-only vs dual-anchor solutions. Displays changes in alpha, K, and w1 distributions side-by-side.
Usage
plot_dual_comparison(
  fit_dual,
  fit_K_only = NULL,
  engine = c("ggplot2", "base"),
  base_size = 10,
  title = NULL,
  show = TRUE
)See also
DPprior_fit for fitting, plot.DPprior_fit for S3 plot method
Other visualization:
DPprior_colors(),
plot_K_prior(),
plot_alpha_prior(),
plot_dual_dashboard(),
plot_prior_dashboard(),
plot_tradeoff_curve(),
plot_tradeoff_dashboard(),
plot_w1_prior(),
theme_DPprior()
Examples
fit_K <- DPprior_fit(J = 50, mu_K = 5, var_K = 8)
#> Warning: HIGH DOMINANCE RISK: P(w1 > 0.5) = 48.1% exceeds 40%.
#>   This may indicate unintended prior behavior (Lee, 2026).
#>   Consider using DPprior_dual() for weight-constrained elicitation.
#>   See ?DPprior_diagnostics for interpretation.
fit_dual <- DPprior_dual(fit_K,
  w1_target = list(prob = list(threshold = 0.5, value = 0.3)),
  lambda = 0.5)
plot_dual_comparison(fit_dual)

#> TableGrob (3 x 2) "dpprior_dashboard": 5 grobs
#>   z     cells              name                 grob
#> 1 1 (2-2,1-1) dpprior_dashboard       gtable[layout]
#> 2 2 (3-3,1-1) dpprior_dashboard       gtable[layout]
#> 3 3 (2-2,2-2) dpprior_dashboard       gtable[layout]
#> 4 4 (3-3,2-2) dpprior_dashboard       gtable[layout]
#> 5 5 (1-1,1-2) dpprior_dashboard text[GRID.text.1555]
#> TableGrob (3 x 2) "dpprior_dashboard": 5 grobs
#> z cells name grob
#> 1 1 (2-2,1-1) dpprior_dashboard gtable[layout]
#> 2 2 (3-3,1-1) dpprior_dashboard gtable[layout]
#> 3 3 (2-2,2-2) dpprior_dashboard gtable[layout]
#> 4 4 (3-3,2-2) dpprior_dashboard gtable[layout]
#> 5 5 (1-1,1-2) dpprior_dashboard text[GRID.text.1555]