3 Reliability, the third axis
Simulation studies of ability estimation usually vary sample size and sometimes test length, reported as a count of items. This study instead targets five levels of a population-level information coefficient, from 0.5 to 0.9. A nested test-length ladder supplies the coarse increase in information, and a global discrimination multiplier is calibrated separately for each model-by-form-by-tier-by-shape cell. This chapter defines the implemented coefficient, distinguishes it from other meanings of reliability, and documents that joint calibration.
3.1 The operational reliability coefficient
For a test information function \(J(\theta)\) and generating distribution \(G\), the study uses
\[ \overline{\mathrm{MSEM}}_J=E_G\{1/J(\theta)\}, \qquad \bar\rho_J=\frac{\operatorname{Var}_G(\theta)} {\operatorname{Var}_G(\theta)+\overline{\mathrm{MSEM}}_J}. \]
The term \(1/J(\theta)\) is the usual inverse-Fisher-information approximation to conditional measurement-error variance. Accordingly, \(\bar\rho_J\) is an inverse-information MSEM design coefficient. It is not the exact conditional error variance of the posterior mean or EAP, not a posterior reliability coefficient, and not the observed-score or parallel-forms reliability of the generated responses. Under the standardized populations used here, \(\operatorname{Var}_G(\theta)=1\) and the coefficient reduces to \(1/[1+E_G\{1/J(\theta)\}]\). On that design scale, \(\bar\rho_J=.9\) makes the square root of the inverse-information error proxy one third of the ability standard deviation, whereas at .5 the two are equal. The coefficient belongs jointly to the form, its discrimination scale and the population against which information is averaged; achieved values, rather than tier labels alone, therefore travel with the generated data (Section 3.3).
A faster average-information index replaces \(E\{1/J(\theta)\}\) with \(1/E\{J(\theta)\}\). Because \(x\mapsto1/x\) is convex, \(E\{1/J(\theta)\}\geq1/E\{J(\theta)\}\), so the inverse-information coefficient used here is no larger than its average-information counterpart; equality requires constant information almost everywhere under \(G\). The generator may use the faster index for warm starts, but only the inverse-information coefficient is refined, independently certified and analyzed.
3.2 An information index shared by both levers
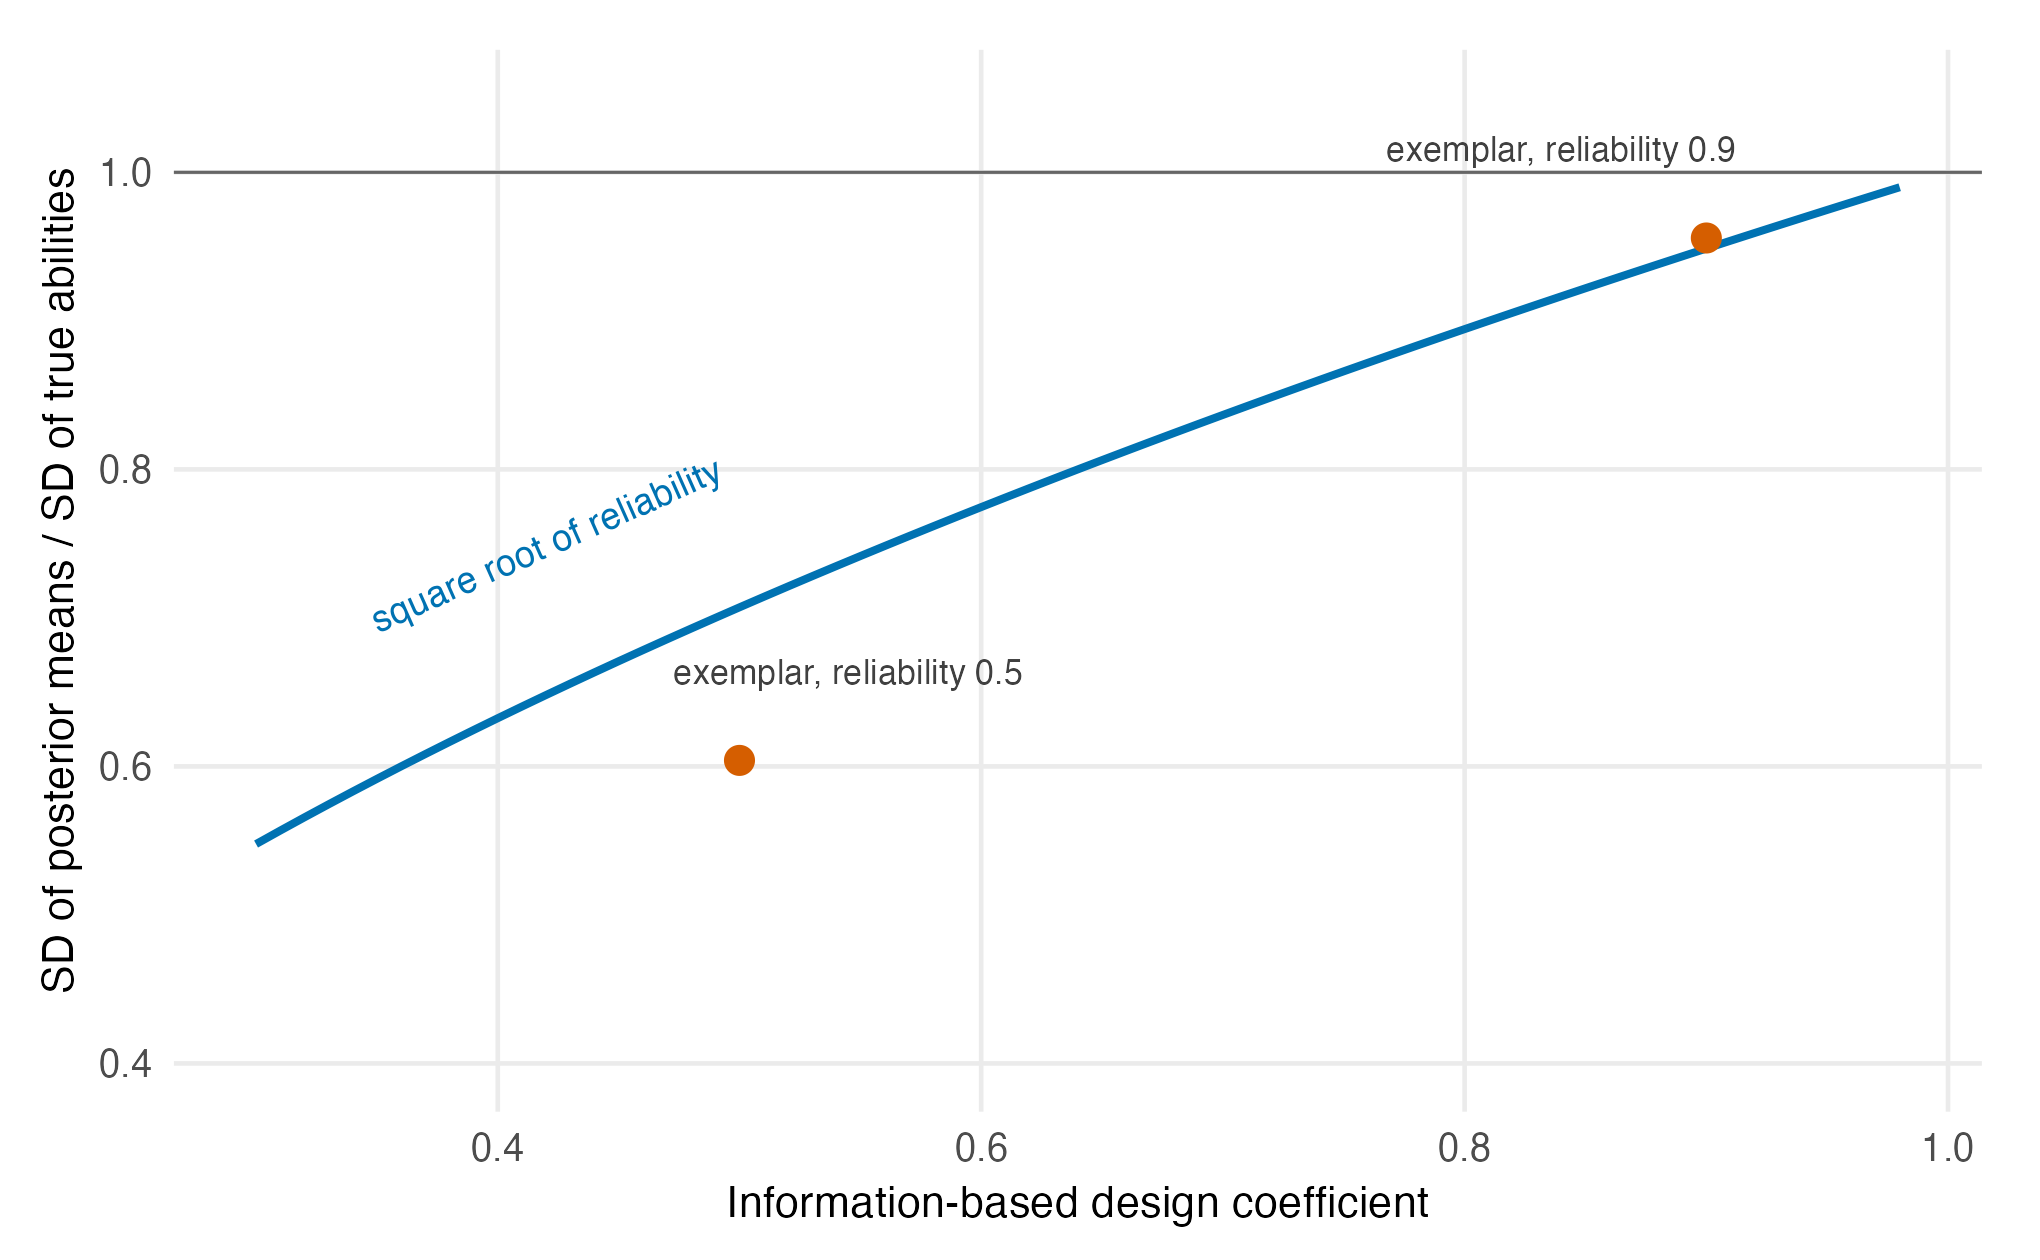
The coefficient indexes an information regime in which both levers can be studied. In the normal–normal, constant-error reference model, the posterior-mean ensemble has standard deviation \(\sqrt{\rho}\) times the true one (Figure 3.1). That identity is a reference, not a theorem for the fitted Gaussian or DPM IRT models and not a bound on what either prior can recover. The empirical exemplars depart from the curve, as expected when information varies over ability and item and population parameters are estimated.
The score structure offers a useful but exploratory mechanism. Short Rasch forms create score-associated bands in the posterior summaries; joint uncertainty in item and population parameters still produces within-score variation, so an eight-item form does not restrict the plotted estimates to nine values. Across the simulated grid, skew-related gains appear at lower tiers than bimodal gains, and the bimodal H6 profile is steeper (Section 8.3, Section 10.2). A plausible interpretation is that separated modes require finer likelihood resolution than broad asymmetry. The study establishes the pattern, not a universal resolution threshold or a causal effect of the scalar coefficient alone.
3.3 Targeting reliability by design
Targeting \(\bar\rho_J\) is an inverse design problem. For each model and form replicate, the generator first selects strictly nested item subsets \(F(.5)\subset\cdots\subset F(.9)\); increasing length supplies the coarse ladder while preserving difficulty coverage. On each fixed subset it then solves for a global discrimination multiplier \(c^\star\) separately for every tier and latent shape. The selected item identities and baseline difficulty geometry are shared across shapes within a tier, but the scaled discriminations used to generate responses are not. Calibration therefore has 150 model-by-form-by-tier-by-shape cells. The frozen multipliers range from 0.794 to 1.090; holding model, form, tier and length fixed, their cross-shape relative range, \((\max c^\star-\min c^\star)/\operatorname{mean}(c^\star)\), has median 1.86% and maximum 5.05%.
The final multiplier is solved on a refinement grid and the achieved coefficient is certified on an independent population grid. Five seeded item banks per model propagate item-bank variation into the form-replicate layer. The reliability-targeting framework supplies the inverse-calibration machinery for \(c^\star\) at fixed length (Lee, 2025); the nested-length search and its combination with cell-specific scale calibration are features of this V3 generator, not a uniqueness result for integer test length.
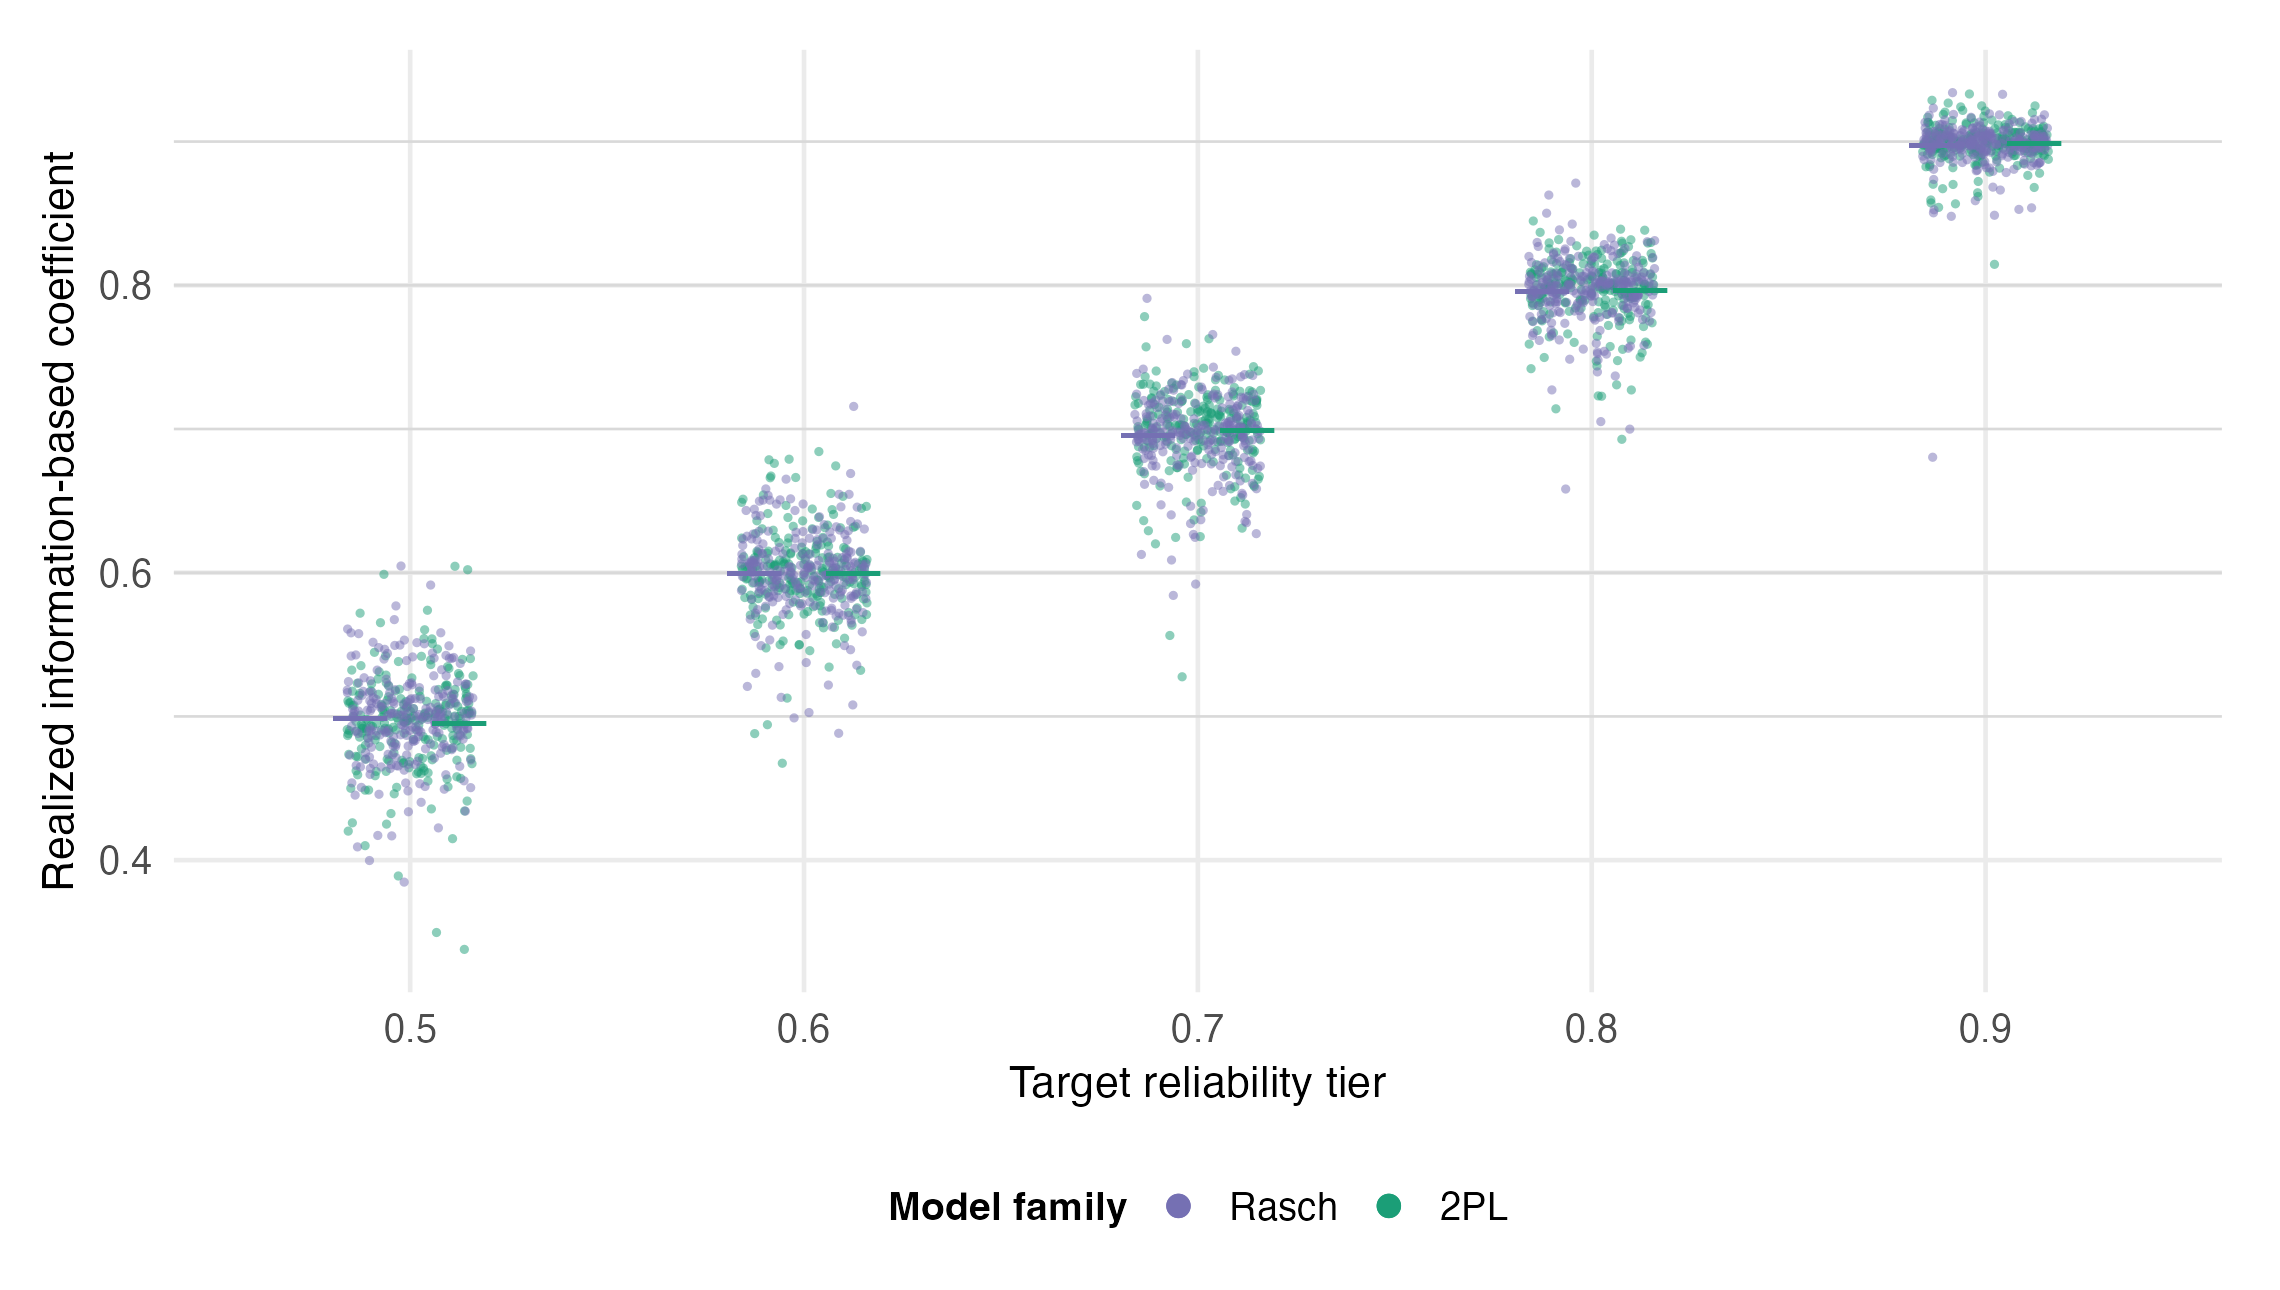
Figure 3.2 shows the outcome over all 2,400 datasets. Analytic model-by-tier means differ from target by at most 0.000, with additional dataset-level scatter from finite samples. The mean nested lengths run from about 8 to 68 items under Rasch and 7 to 62 under the 2PL. Those large length changes are the dominant coarse manipulation, but they are followed by the nontrivial \(c^\star\) refinements just described. Reliability, length and discrimination are therefore correlated parts of one realized design ladder, not identical variables.
Equalizing one scalar does not equalize the whole information function \(J(\theta)\). Because the same difficulty geometry is averaged against differently shaped populations, tail-region information can still differ across shapes after \(\bar\rho_J\) is matched. The primary prior-arm comparisons are paired within each generated cell and use the same response data, so cross-shape differences in \(c^\star\) are not an arm-level confound. Cross-shape mechanisms and transport to other combinations of length, discrimination, difficulty geometry or population spread remain exploratory (Chapter 17).