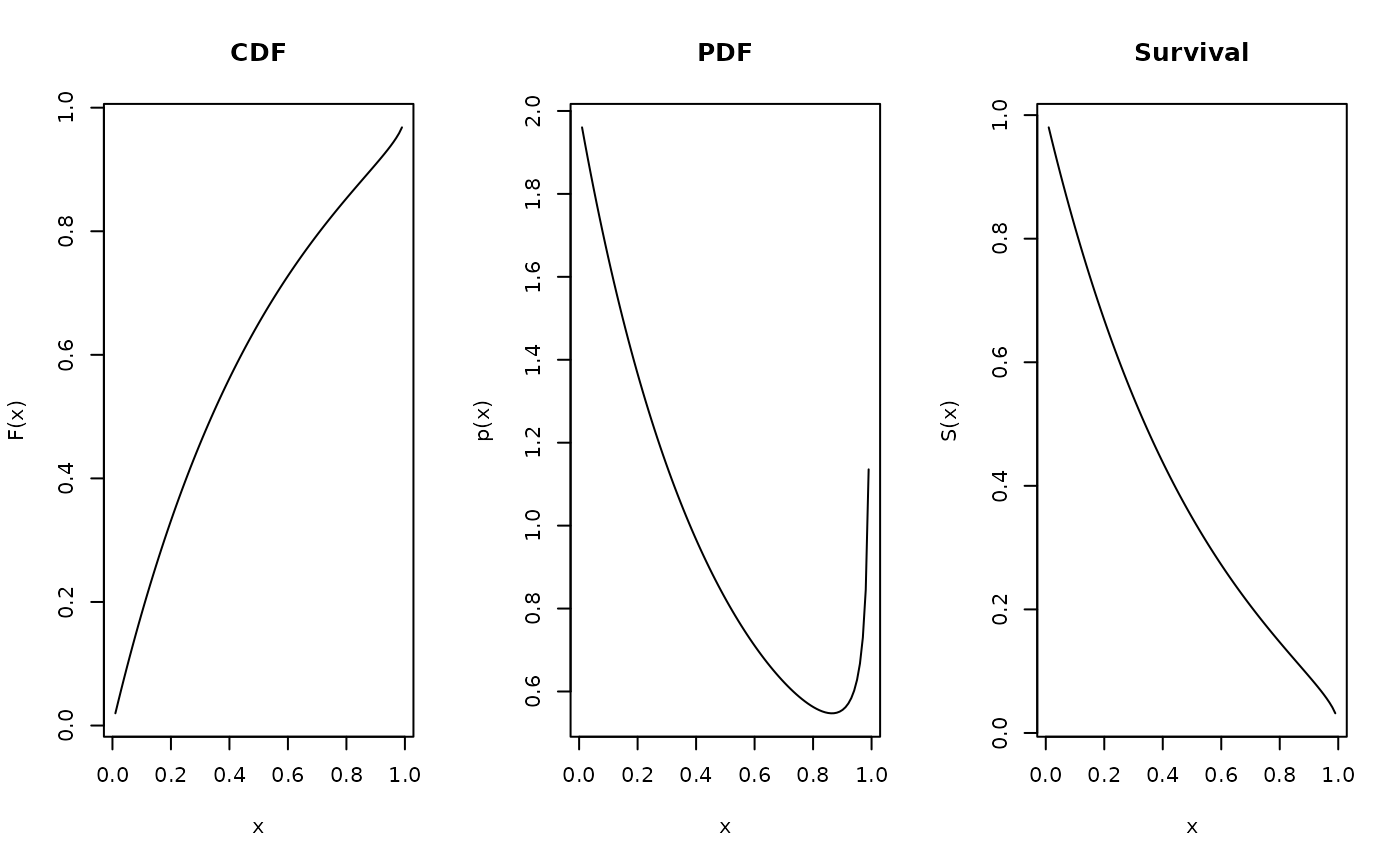
Computes CDF, PDF, and survival function on a grid of x values. Useful for visualization and comparison across different priors.
Usage
w1_grid(a, b, x_grid = seq(0.01, 0.99, length.out = 100))Value
A data frame with columns:
- x
Grid points
- cdf
CDF values F(x)
Density values p(x)
- survival
Survival function S(x) = 1 - F(x)
Examples
# Compute on default grid
df <- w1_grid(a = 2, b = 1)

# Plot all three functions
par(mfrow = c(1, 3))
plot(df$x, df$cdf, type = "l", main = "CDF", xlab = "x", ylab = "F(x)")
plot(df$x, df$pdf, type = "l", main = "PDF", xlab = "x", ylab = "p(x)")
plot(df$x, df$survival, type = "l", main = "Survival", xlab = "x", ylab = "S(x)")