Simulation study
We investigate how prior choice affects cluster recovery as the true cluster count, data informativeness and elicited count judgment vary. Each cell has 200 planned replications. The data generator fixes the number of units in each component, centers the site effects and rescales their sample standard deviation to .25. Sampling variance is 4 divided by site size.
Reconstruct the main comparisons
Rscript simulation/01_reaggregate.R
Rscript simulation/02_primary_and_paired.R
Rscript verification/check_simulation.R
The full design contains 322 cells and 64,400 planned fits. Prior calibration excludes 2,800 fits before sampling. A further 4,449 of the 61,600 attempted fits fail the final diagnostic rule, leaving 57,151 for analysis. These exclusions determine the denominators used when aggregating results.
The main comparison uses the 45 cells with an \(N(0,1)\) prior on the grand mean. It retains 8,607 of 9,000 planned fits, with 155–200 in each cell. OSM Table F.5 gives the cell-specific denominators. The aggregation functions calculate the summaries from fit-level metrics after the input checks.
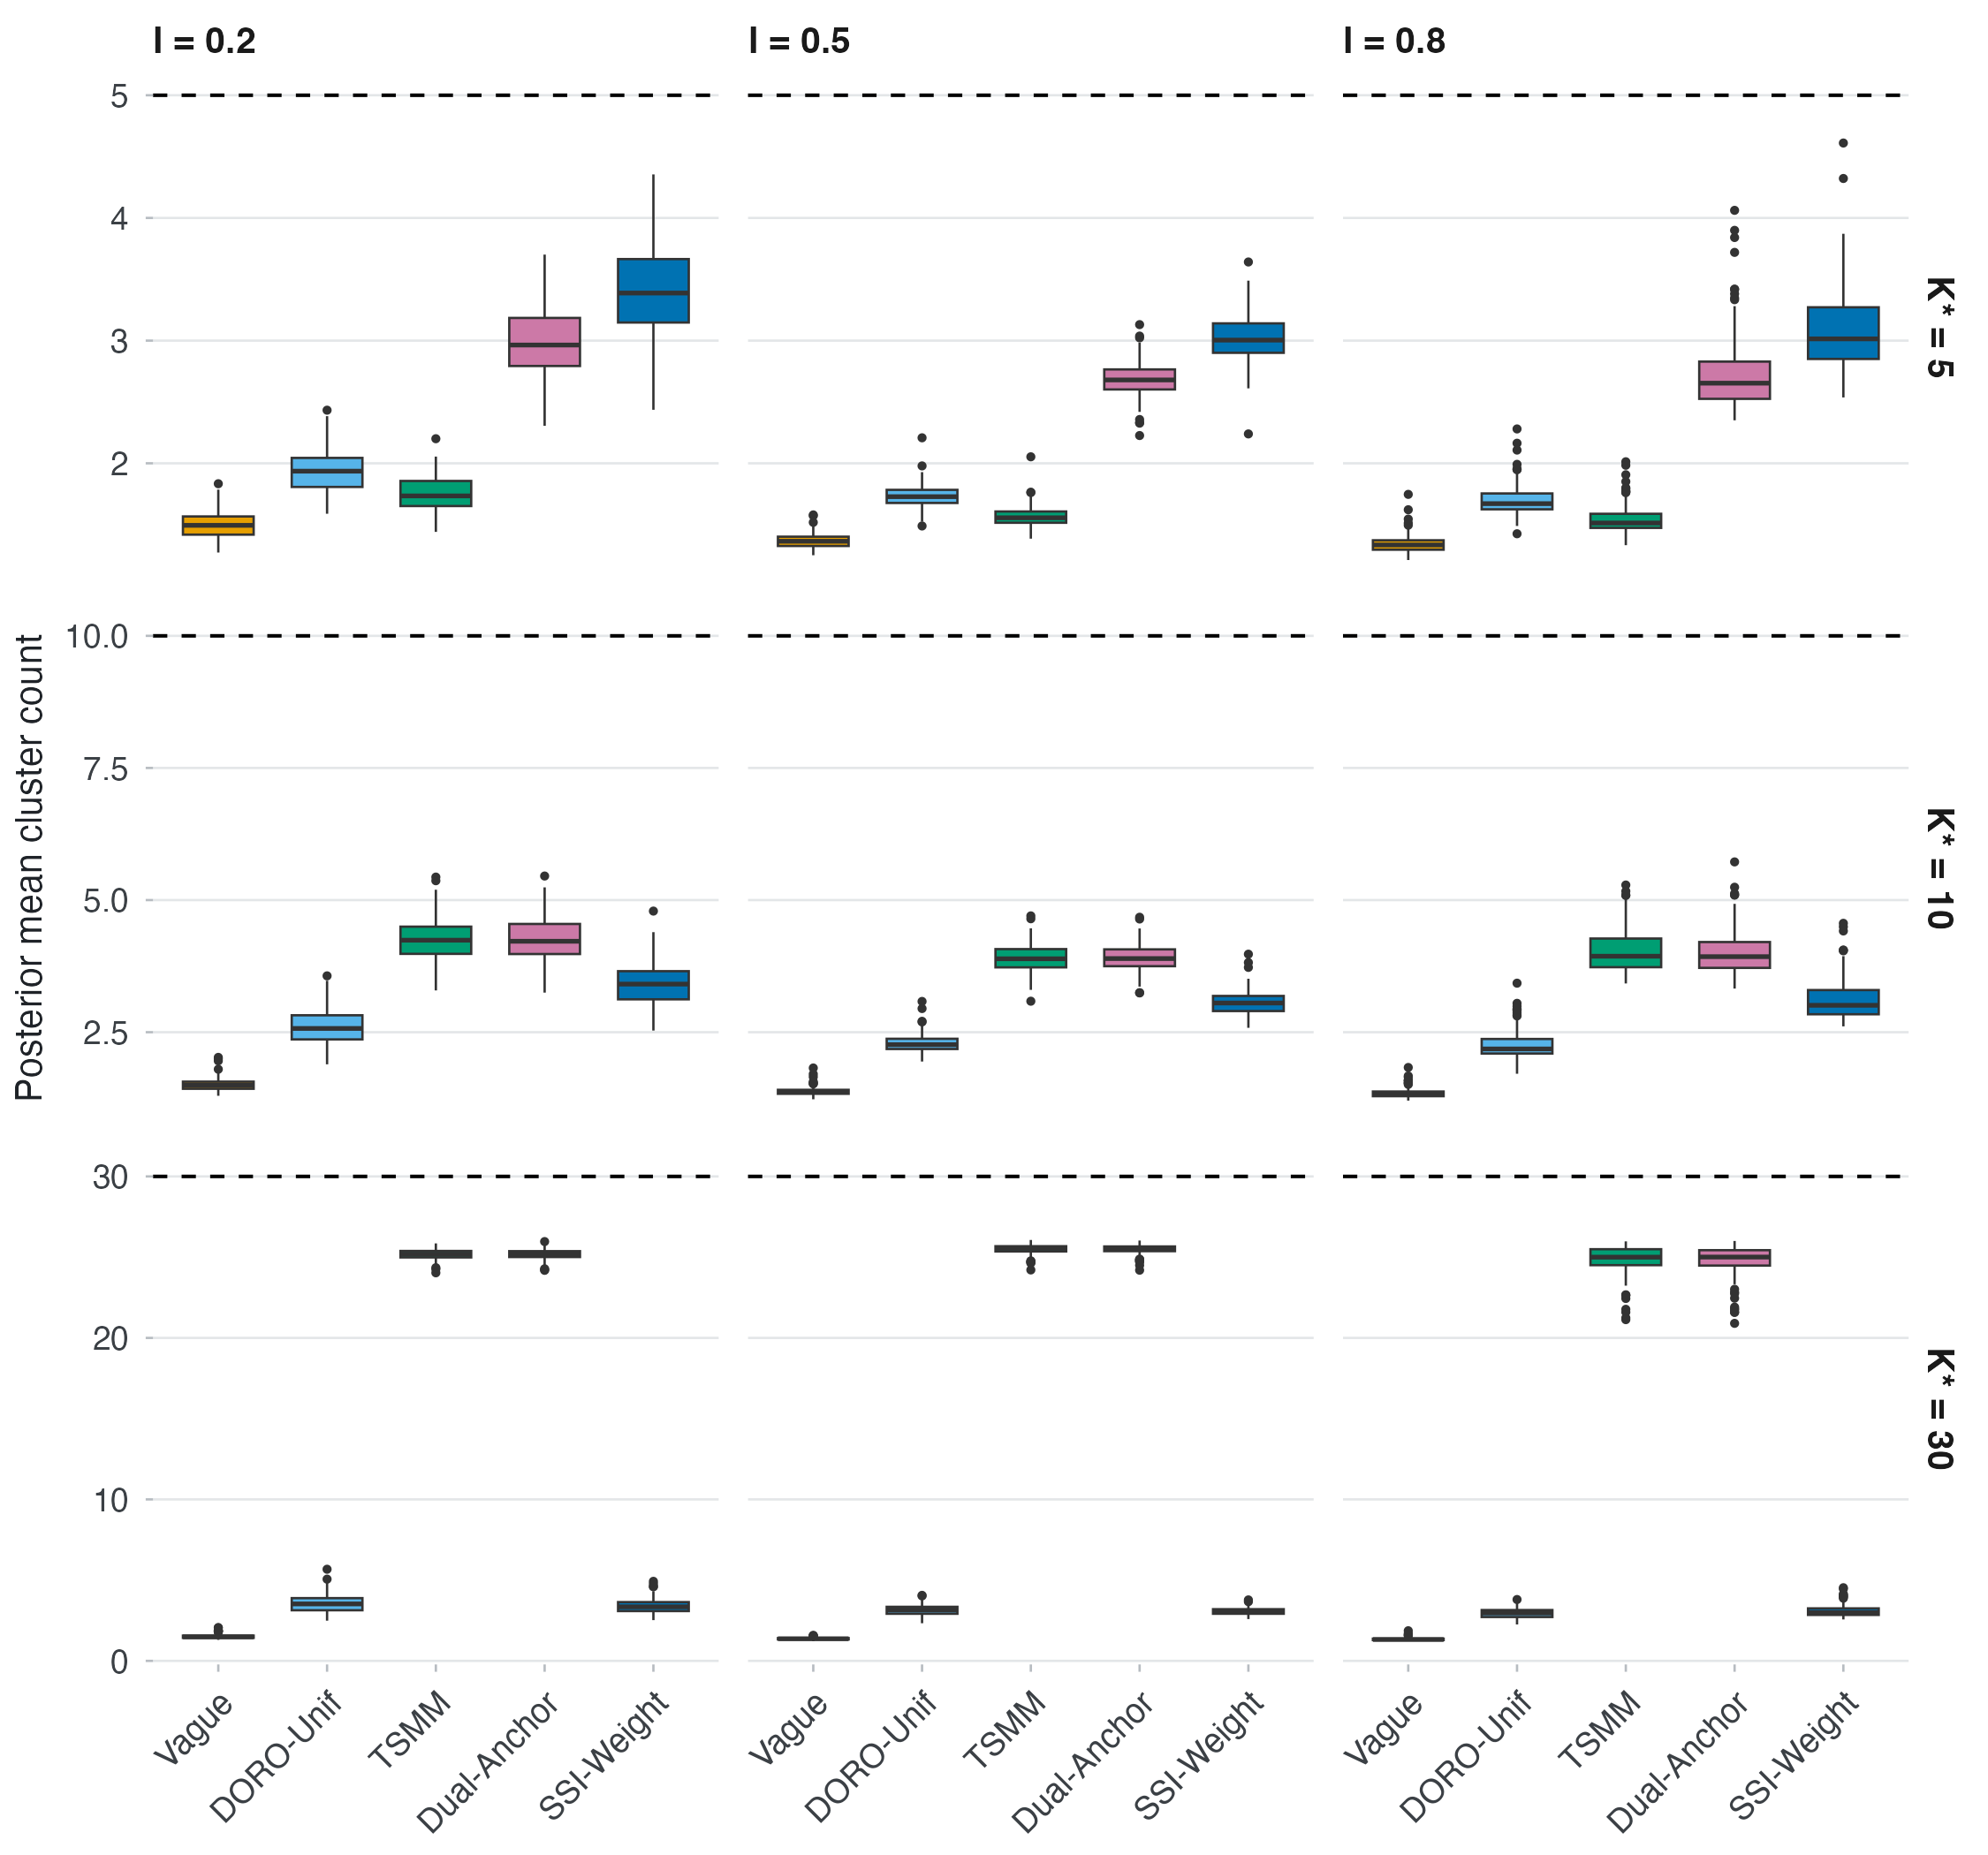
Each box shows variation in the posterior mean count across replications. For low informativeness and five generating clusters, the mean posterior single-cluster probability is .616 under TSMM and .315 under Dual-Anchor. The corresponding mean counts are 1.75 and 3.00. DORO-Unif provides an external comparison.
Compare grand-mean priors
The \(N(0,.01)\), \(N(0,1)\) and \(N(0,100)\) analyses use the same simulated data. We calculate paired differences using replications that pass the diagnostic rule under both priors. Contrasts are reported as right minus left in OSM Figure F.1. Its percentile ranges describe the distribution of paired differences across replications.
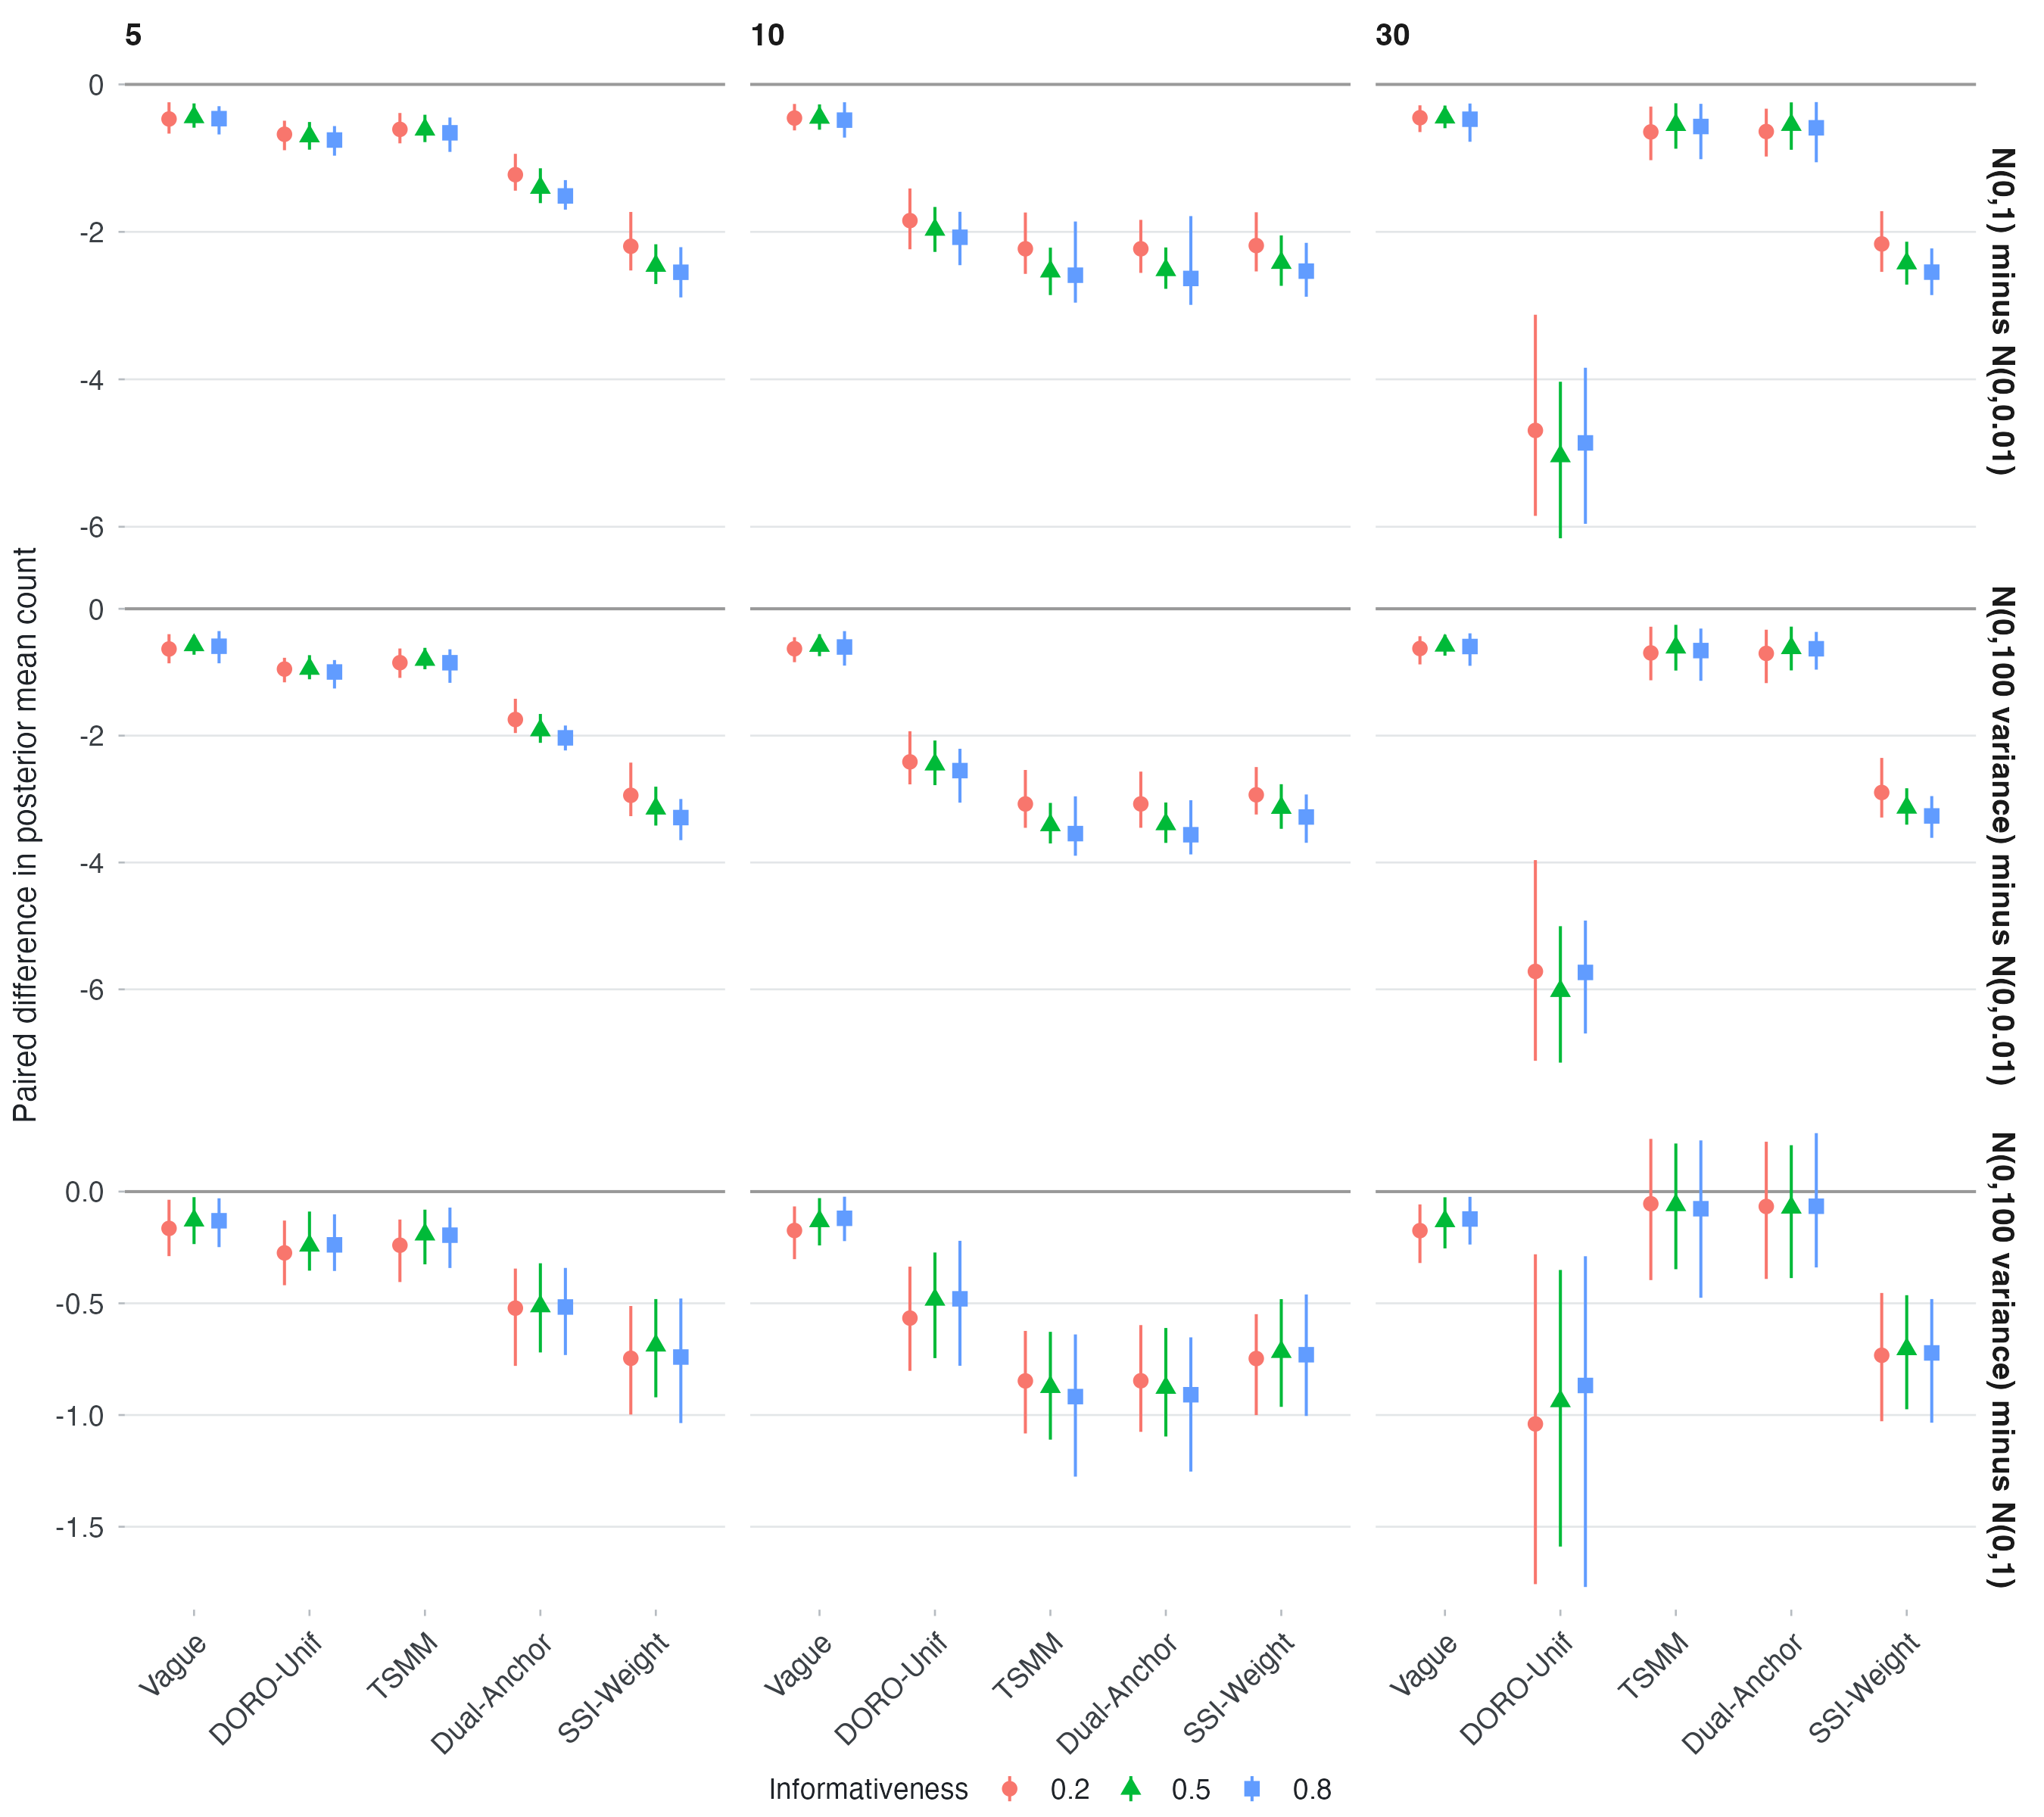
Relative to grand-mean variance .01, variances 1 and 100 reduce the posterior mean count by about 1.61 and 2.08, respectively, averaged over the 45 cells. The seed manifest preserves the assignments used to match the simulated data across these comparisons.
Examine the extensions
Rscript simulation/03_misspecification.R
Rscript simulation/04_design_size.R
Rscript simulation/05_unequal_weights.R
Rscript simulation/06_fixed_lambda.R
The medium-confidence misspecification design has results for 56 of 60 cells. To compare the same settings along each curve, Figure 5 includes only complete three-point trajectories. The omitted cells remain in the diagnostic CSV. OSM Table F.7 contains 36 rows from the completed trajectories, including six with VIF=5.
The design-size comparison also uses complete trajectories and removes duplicate external-reference variants. Some high-informativeness cells at \(J=200\) retain substantially fewer fits; their denominators are given in OSM Tables F.8–F.9.
The unequal-weight experiment places 60% of units in one component and varies its location. OSM Table F.10 shows both location schemes. Table F.11 compares the selected \(\lambda=.16\) with fixed values .50 and .90. These scripts use the stored fit metrics. The refitting chapter gives the commands for generating new data and fitting a selected model.