Provides the same functionality as plot.svyder() but
requires ggplot2 and always returns a ggplot object.
This is the preferred method when using ggplot2 directly.
Usage
autoplot.svyder(
  object,
  type = c("profile", "decomposition", "comparison"),
  ...
)See also
plot.svyder() for the generic plot method.
Other visualization:
plot.svyder()
Examples
data(nsece_demo)
result <- der_diagnose(
nsece_demo$draws,
y = nsece_demo$y, X = nsece_demo$X,
group = nsece_demo$group, weights = nsece_demo$weights,
psu = nsece_demo$psu, family = "binomial",
sigma_theta = nsece_demo$sigma_theta,
param_types = nsece_demo$param_types
)
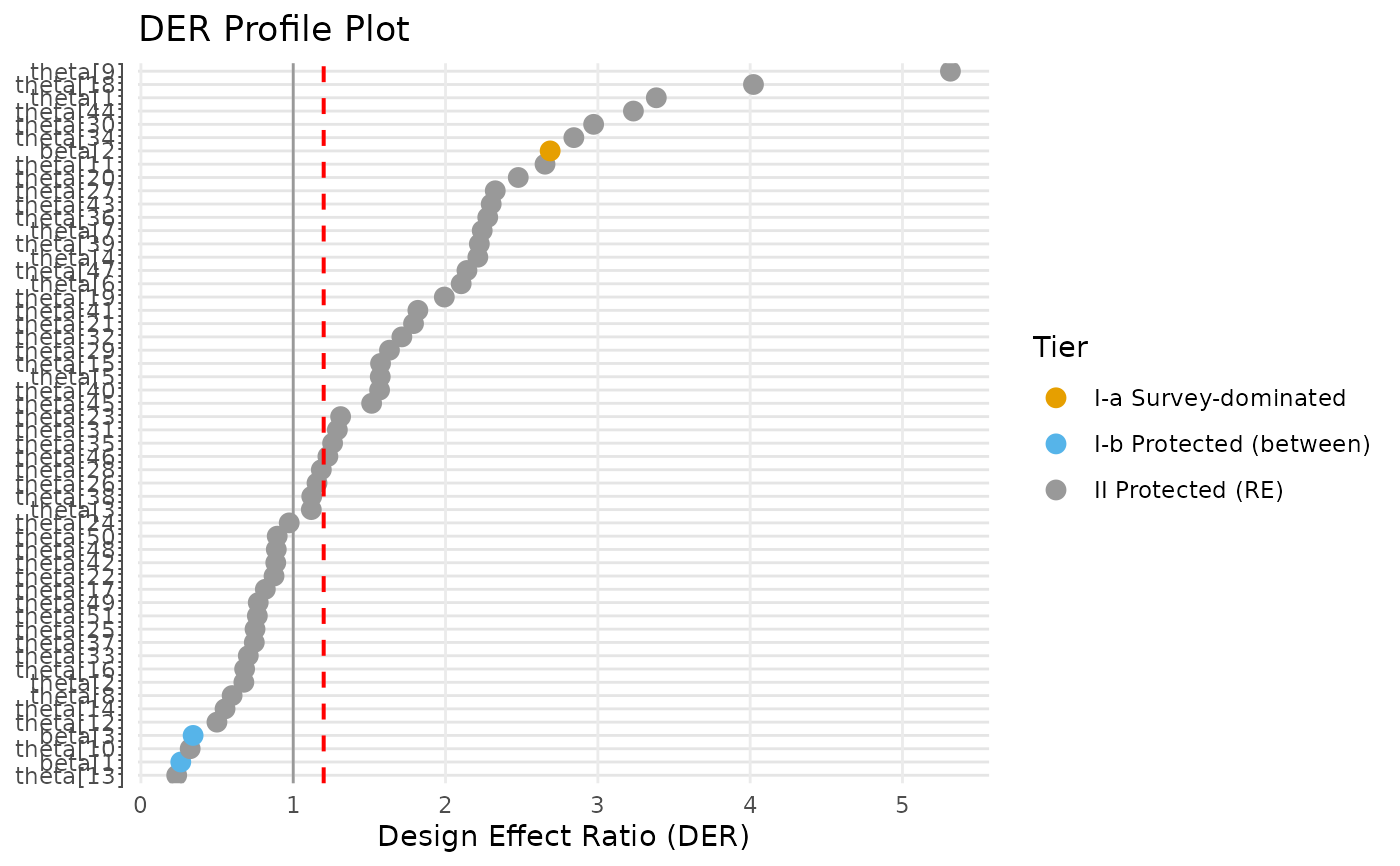
if (requireNamespace("ggplot2", quietly = TRUE)) {
ggplot2::autoplot(result, type = "profile")
}